Massachusetts should strive to meet the needs of its diverse population as equitably as possible, and the Commonwealth’s budget is one of its most important tools for achieving that goal. Unfortunately, laws that limit the amount of tax revenue we can raise as a state get in the way. The 1986 tax cap law, also known as “62F,” artificially limits the amount of tax revenue available to address priorities like affordable, quality childcare, safer public transportation, and affordable housing. Moreover, there are flaws in the 62F law and its underlying formula. 62F tells a story about revenue in Massachusetts, but it is misleading.
Don’t Limit Yourself
The 62F law is an example of a tax cap or tax limitation, which is legislation that limits the amount of tax revenue a state can collect. Tax caps are problematic for multiple reasons.
First, public responsibilities and commitments change over time, but tax caps limit available revenue to support these activities. Think about how we as a Commonwealth have decided to invest in education and health reform, climate change, and pandemic responses, all things that have changed since 62F was passed in 1986.
Second, tax cap legislation limits choice. Tax caps hampers legislators’ ability to respond in real time to changes in the economy and the diverse needs of our population. In fact, just this summer the threat of 62F being triggered derailed desperately needed investments in our communities.1
Third, tax caps can exacerbate inequality and may even limit economic growth2 by limiting funding for programs that reduce inequality and promote prosperity. Think of what else we could do with the $2.9 billion that 62F will return to mostly wealthy taxpayers,3 from increasing the supply of affordable housing to reducing the cost of childcare and expanding access to mental health services.
A Paradox
The 62F law was triggered this year, but is that because tax revenues were actually too high? One way to look at tax revenues is to compare them each year to the size of the state’s economy as measured by total state personal income. Total personal income includes salaries, wages, income from capital gains and interest, and government transfers like unemployment benefits.4 Total personal income is one way of measuring the total resources we have available as a community, resources from which we pay taxes to address our needs and those of our neighbors.
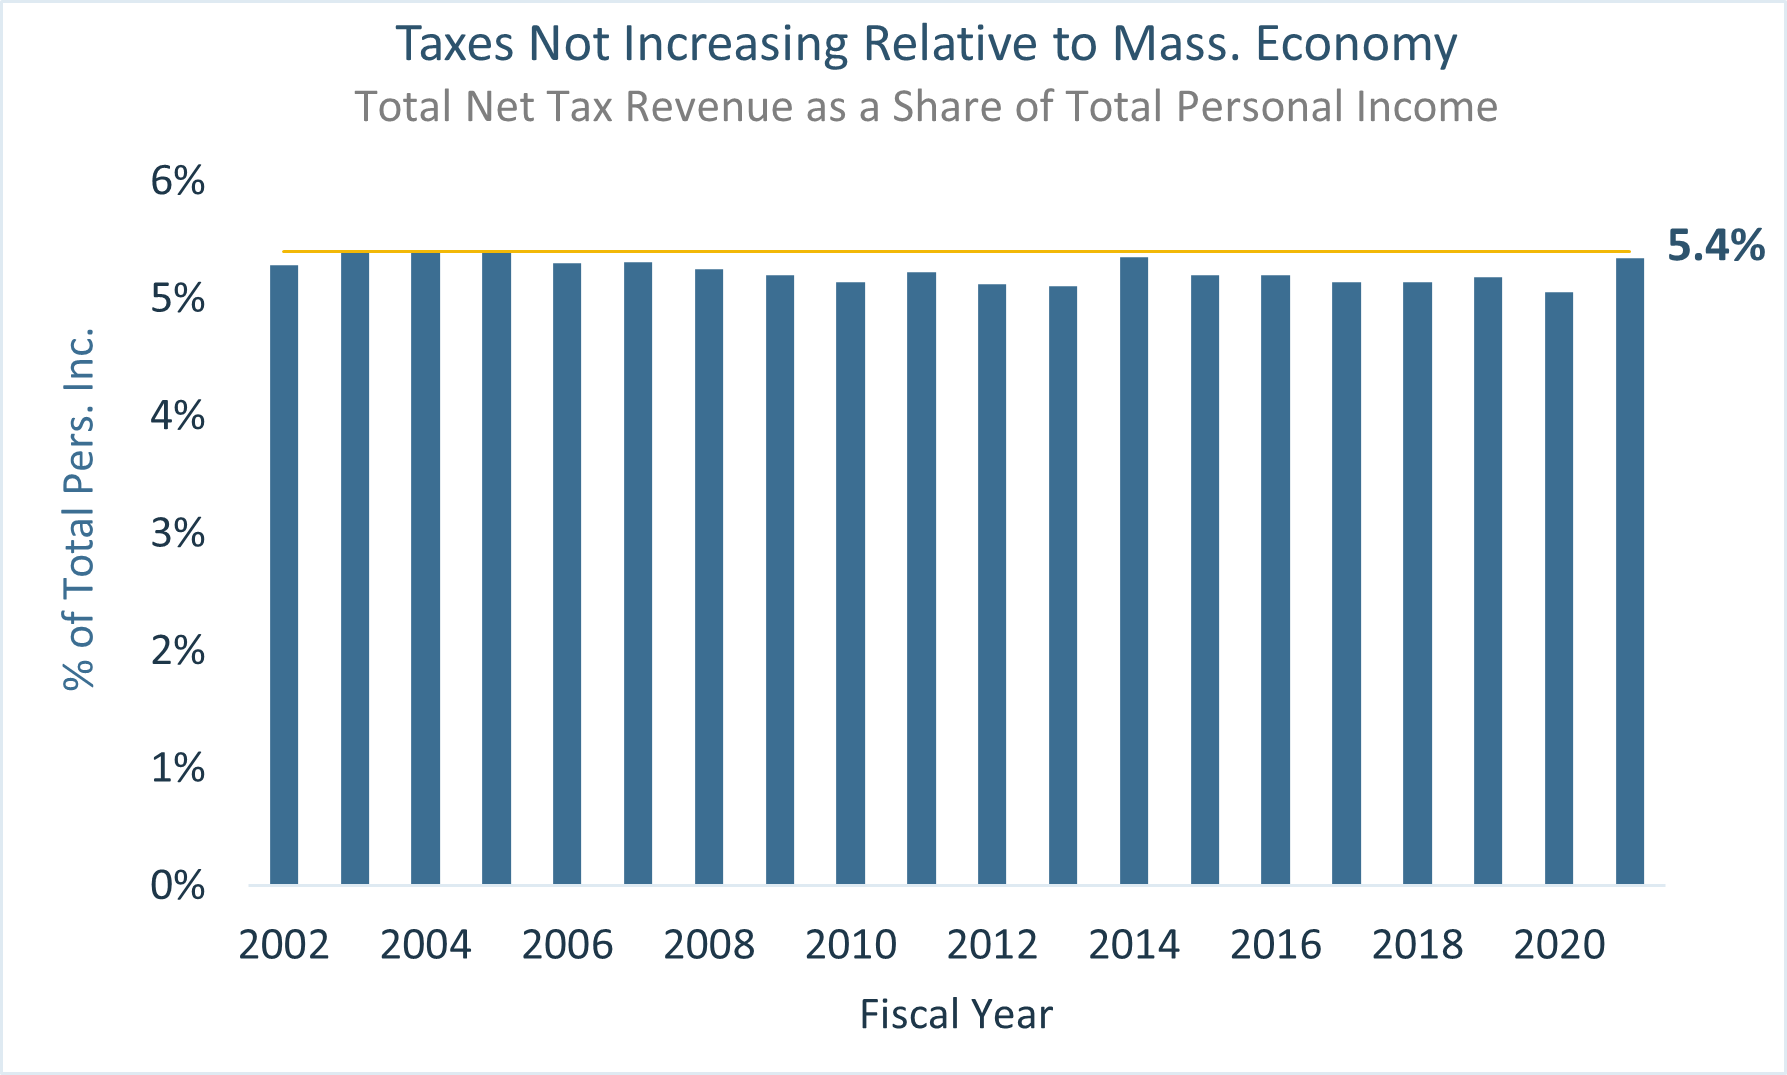
Total tax revenue as a share of total personal income has been relatively stable in Massachusetts since 2002. Figure 1 shows that net tax revenue was 5.4% of total state personal income in Massachusetts in Fiscal Year (FY) 2004 and has not reached that level since.5

Figure 1
So why was 62F triggered if taxes have remained fairly steady as a share of the economy? 2022 represents a perfect storm of factors that may paint a distorted picture of revenue growth under the 62F formula.
A Perfect Storm?
62F seems to have been triggered this year because of a combination of factors that do not necessarily imply that the state has too much money. A large increase in inflation, enhanced federal employment benefits, and a tax law change may have all combined to trigger 62F in FY 2022. The 62F law measures the full impact of these factors on tax revenue growth but only partially on income growth. This results in a distorted picture of the state’s fiscal position. The fact that 62F accounts for personal income in a unique, incomplete way may add to this distortion. Let’s look at each of these factors in more detail.
Prices Skyrocketing
Inflation increased rapidly this year, but this was only partially reflected in the 62F calculation. Prices for all items, which includes food and energy, increased 7 percent from July 2021 to July 2022.6 Food prices alone increased 10.3 percent over that period! Remember that sales tax revenue will increase when prices that are subject to the sales tax rise because the same tax rate is applied to higher prices.
The 62F formula compares one year of tax revenue growth with the average of three years of growth in wages and salaries. Using a single year of tax revenue wholly reflects the single year rapid increase in inflation. On the other hand, using a three year wage and salary growth rate calculation means that the single-year inflation spike is dampened by the lower inflation rates of the prior two years.
The 62F “overage” for FY 2022 would have been substantially smaller if, for example, the 62F formula accounted for inflation in the same way for both tax revenue and wages and salaries. If the formula looked at just one year of growth in both tax revenue and wages and salaries, the FY 2022 overage would have dropped from $2.9 billion to $696 million (Table 1). This is not necessarily a preferred method, as growth in wages and salaries is not a complete measure of growth in the economy as a whole. The point is that the current 62F formula may not accurately capture the fiscal effects of a spike in inflation.
| FY22 62F Projection Using 1 Year of Wage and Salary Growth | |
|---|---|
| Component of 62F Formula | Value |
| FY 2022 Net State Revenue | $41,812,654,358 |
| Allowable Tax Revenues FY 2021 | $36,789,926,416 |
| Growth Factor (1 YR Wage and Salary Growth) | 1.118 |
| FY 2022 Allowable State Revenue | $41,117,111,359 |
| Projected "Overage" | ($695,542,999) |
Increased Federal Aid
The federal government provided expanded unemployment insurance (UI) benefits during the pandemic to help hard-hit households. The 62F formula only partially accounts for this. Unprecedented numbers of Massachusetts workers were kept from earning wages or salaries by the pandemic, and UI benefits served as replacement income. Recipients of unemployment benefits paid taxes on these benefits in FY 2022.7 UI recipients further increased state revenues as they spent unemployment benefit dollars in the economy, thereby paying sales and gas taxes, rents, and more, and boosting the taxable incomes of others.
The 62F formula did not account for the increased income from UI benefits as the law only measures growth in income from wages and salaries. So, the pandemic artificially pushed down the wages and salaries side of the 62F equation while temporarily elevating the revenue side via increased federal UI benefits.
Figure 2 shows the immense change in federal support for UI benefits in Massachusetts as the pandemic unfolded. In FY 2022, $4.3 billion in unemployment payments were made to Massachusetts workers in need of assistance, 64% of which was paid for by the federal government.8 Note that while unemployment benefits are generally taxable (and are taxable in tax year 2022),9 Massachusetts allowed for a deduction of up to $10,200 of UI benefits in tax years 2020 and 2021.10

Figure 2
Including government transfers (such as income from federal unemployment benefits) along with wages and salaries in the 62F measure of income might have decreased the amount of overage in FY 2022. The 3-year growth rate of wages, salaries, and government transfers was 1.077, compared with 1.057 (rounded) from the State Auditor’s 62F report. This would have decreased the overage from $2.9 Billion to $2.18 billion (See Table 3).
| Growth Rate Calculation for Wage, Salary, and Transfers | |||
|---|---|---|---|
| CY | Wage & Salary + Transfers | Annual Growth Rate | 3 Year Average Growth |
| 2018 | $336,206,671,000 | ||
| 2019 | $353,949,065,000 | 1.053 | |
| 2020 | $384,718,710,000 | 1.087 | |
| 2021 | $420,246,629,000 | 1.093 | 1.077 |
| Simulated 62F Calculation Including Transfer Income | |
|---|---|
| Component of 62F Formula | Value |
| FY 2022 Net State Revenue | $41,812,654,358 |
| Allowable Tax Revenues FY 2021 | $36,789,926,416 |
| Growth Factor (3 YR Wage + Transfer Growth) | 1.077 |
| FY 2022 Allowable State Revenue | $39,635,657,564 |
| Projected “Overage” | ($2,176,996,793) |
Which Income and When Does it Count?
The 62F formula only considers one form of income, wages and salaries, which is a shrinking component of total personal income. Excluding components of personal income from the 62F calculation can distort our view of the Commonwealth’s fiscal reality. For example, we saw in the previous section that including government transfers in the income part of the 62F formula would have lowered the FY 2022 62F overage.
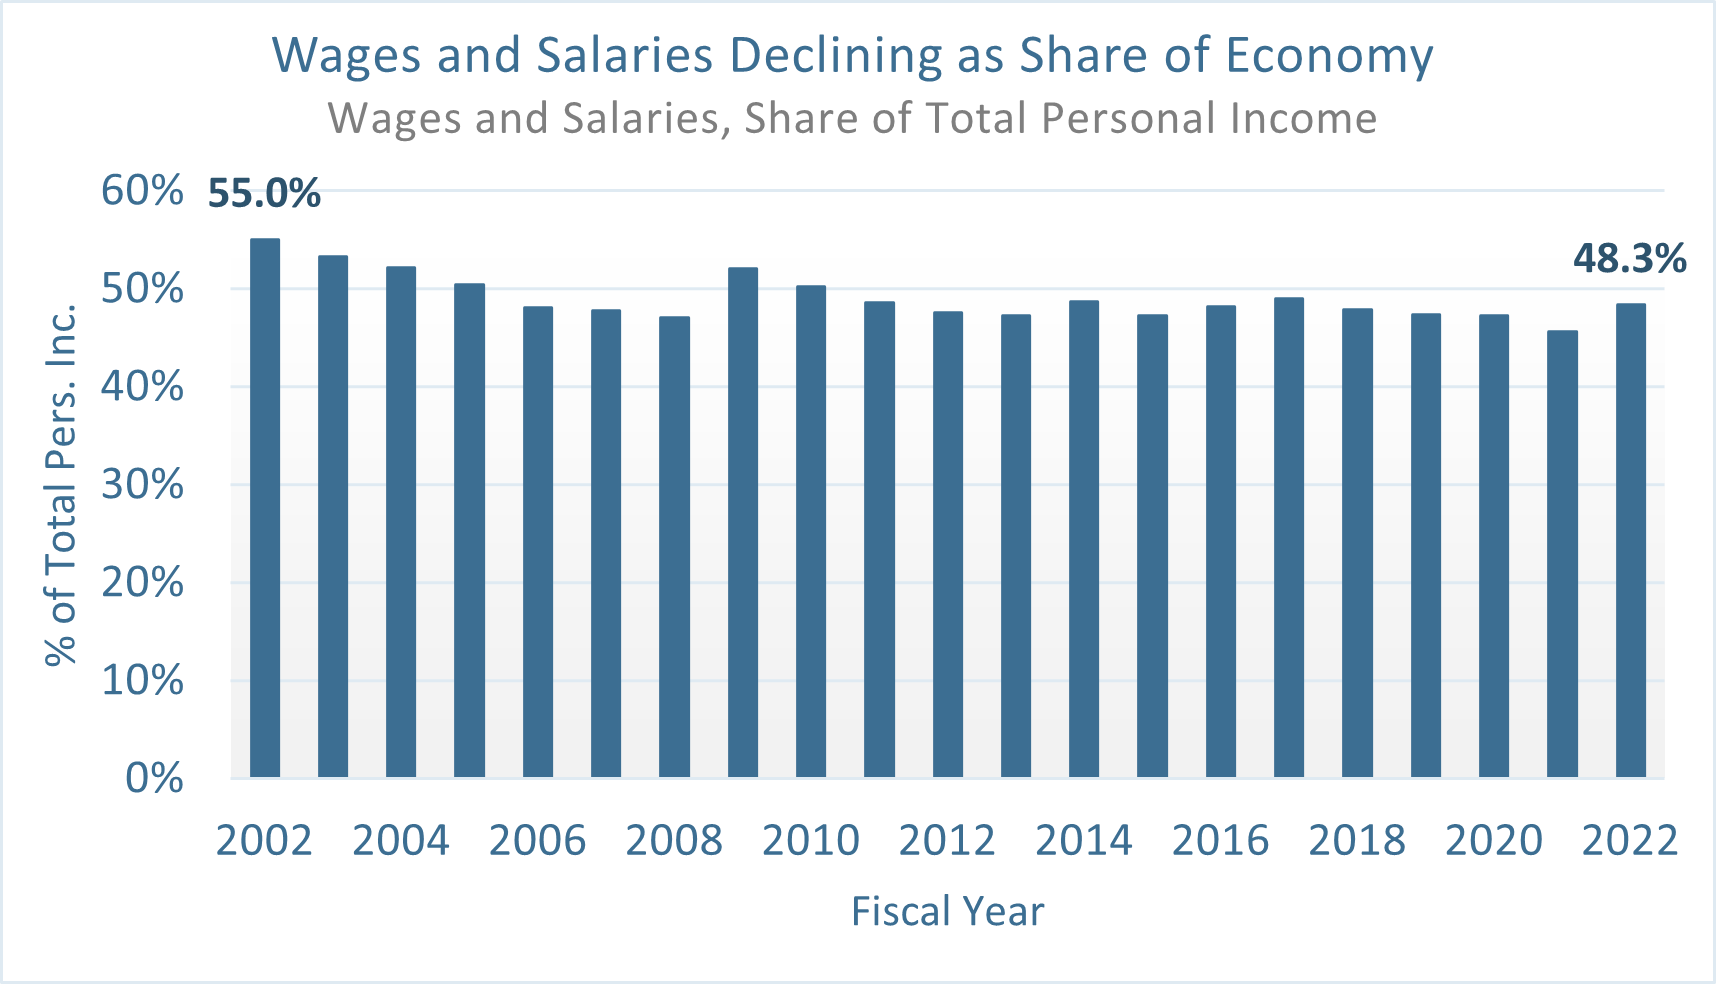
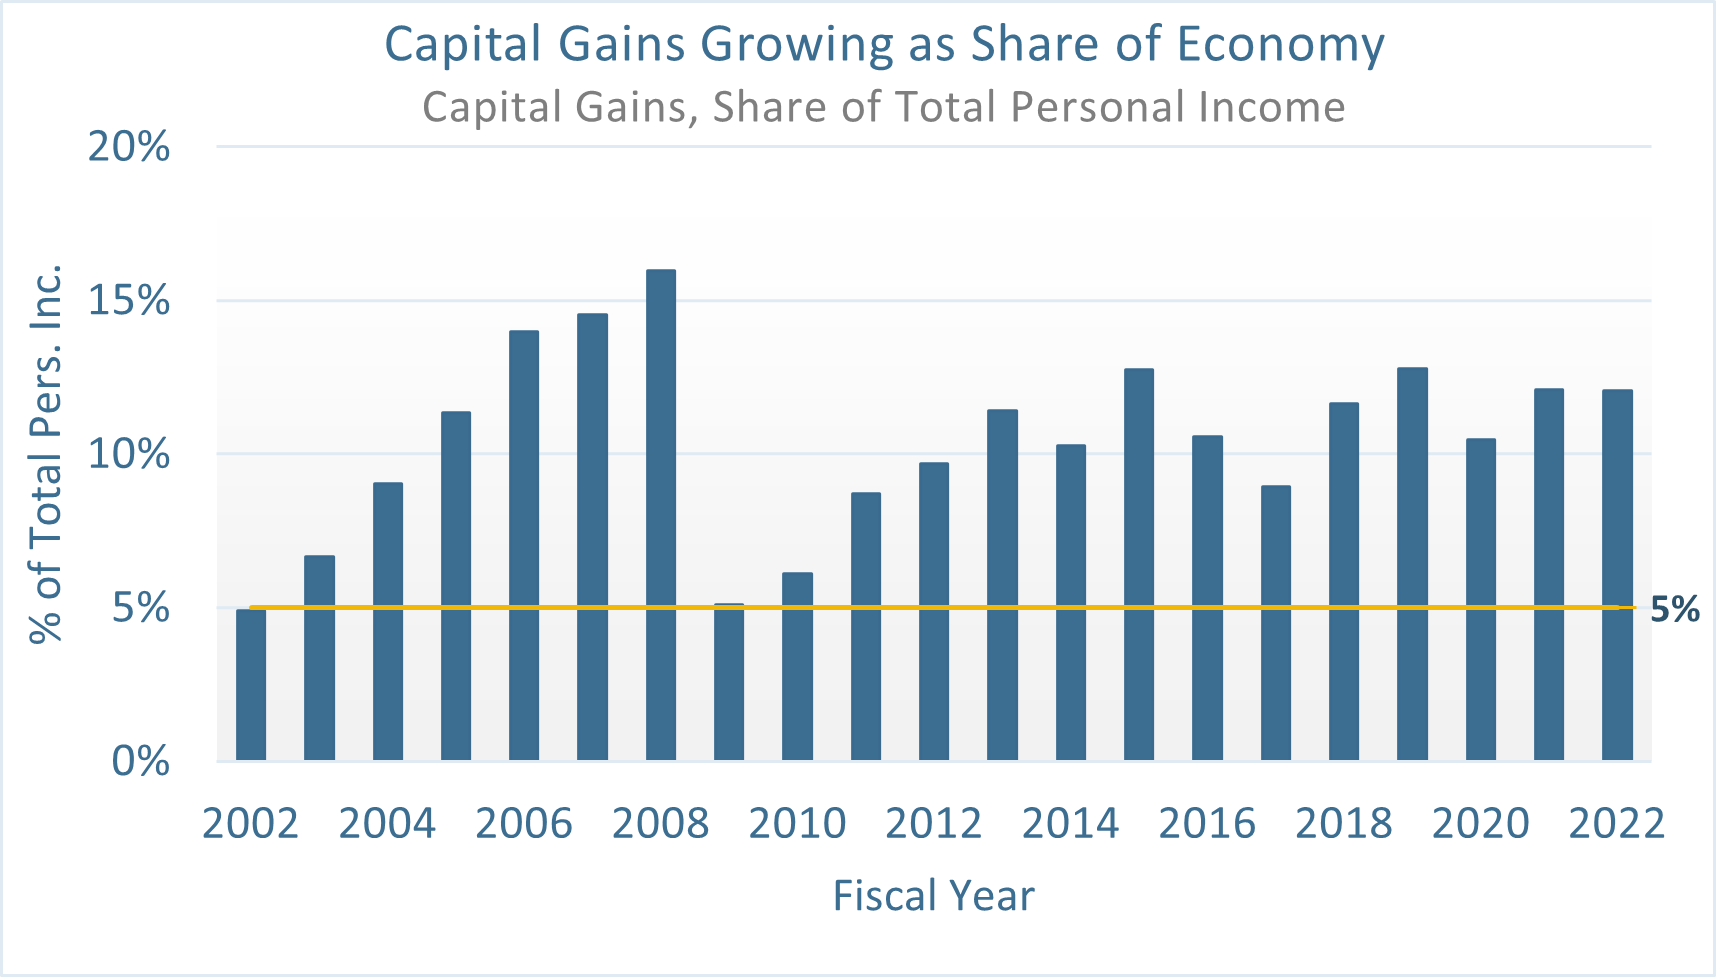
There have been structural shifts in how people make money over the last few decades, and this may influence the likelihood of 62F being triggered in the future. Consider that wage and salary income, the measure of income 62F currently uses, has decreased from 55 percent of total personal income in FY 2002 to 48 percent of total personal income in FY 2022 (See Figure 3).11 This may be related to the increasing importance of so-called passive income, or income from things like capital gains and rents, over this period. In fact, capital gains income increased from about 5 percent of total personal income in FY 2002 to 12 percent in FY 2022 (see Figure 4).12 Figure 4 shows that capital gains income has represented over 5 percent of total personal income in all but two of the years between 2002 and 2022.

Figure 3

Figure 4
This structural shift in the way people earn money is important because different forms of income respond differently to economic trends like recessions, and because changes in one form of income may not accurately represent changes in total personal income. For instance, growth in wages and salaries was lower than the growth in capital gains income for 14 of the 19 years between FY 2003 and FY 202213 We should base our tax policy decisions on a more holistic view of the economy, especially since there are structural changes in the economy over time.
The methodology underlying 62F presents only a partial view of total personal income and not an accurate picture of the resources we have available as a community to address our needs and those of our neighbors. While there are multiple alternative measures of personal income, it seems clear that the measure the law currently uses is flawed.
Creative Accounting
Another reason 62F was triggered this year has to do with a change in tax law that created a timing mismatch between tax payments and tax credits for owners of businesses called “pass-through entities (PTEs).”14 This tax law change allows owners of PTEs to essentially use their business to pay their individual state personal income taxes. An income tax credit is then issued to the business owner for 90 percent of the total PTE tax paid at the business level.
However, business owners who have paid the PTE excise tax in FY 2022 and are eligible for a PTE credit do not have to claim the credit this year. This timing misalignment has resulted in about $1.4 billion in guaranteed PTE credits being counted in this year’s 62F overage calculation despite the fact that this money is already due back to PTE excise payers. This means the FY 2022 62F “excess” is essentially overstated by some $1.4 billion.
Pulling it Together
62F, also known as the “tax cap law,” is flawed policy that may exacerbate inequality15 and limit our ability to meet the needs of our diverse community. Tax cap legislation is bad policy in general, and this specific tax cap has multiple flaws that were exposed by the unique circumstances of 2022. These flaws interacted with spiking inflation, increased federal unemployment benefits, and a tax law change to create a mirage of “excess” tax revenue. Now the Commonwealth will roll out 62F credits that favor wealthier residents rather than acting on priorities that improve our communities.
Endnotes
1 Groggy lawmakers pull the plug on $1b tax package. Commonwealth Magazine. https://commonwealthmagazine.org/state-government/groggy-lawmakers-pull-the-plug-on-1b-tax-package/
2 Deller, S., Maher, C., & Stallmann, J. (2021). Do tax and expenditure limitations exacerbate rising income inequality? Economics & Politics, 33, 611-643. doi: 10.1111/ecpo.12177
3 62F Credits Benefit the Rich. MassBudget. https://massbudget.org/2022/09/22/62f-credits-benefit-the-rich/
4 MassBudget includes capital gains income in total personal income, but other measures do not. Including capital gains paints a more accurate picture of the resources available in our state. Our adjustments to the state personal income measure currently go back to 2002, but we hope to expand that dataset in the future.
5 Total Net Tax Revenue obtained from State Auditor’s 62F reports: https://www.mass.gov/audit-reports
6 BLS report: 22-1663-BOS. Retrieved from https://www.bls.gov/regions/new-england/news-release/consumerpriceindex_boston.htm
7 See Section 26 of Chapter 9 of the Acts of 2021: https://malegislature.gov/Laws/SessionLaws/Acts/2021/Chapter9
8 Author’s analysis of data obtained from: https://tcf-ui-data.shinyapps.io/ui-data-explorer/
9 See Section 29E of Chapter 151A: https://malegislature.gov/Laws/GeneralLaws/PartI/TitleXXI/Chapter151A/Section29E
10 Up to $10,200 of UI benefits are deductible in tax years 2020 and 2021; Section 26(b) Chapter 9 of the Acts of 2021 https://malegislature.gov/Laws/SessionLaws/Acts/2021/Chapter9
11 Bureau of Economic Analysis, https://apps.bea.gov/itable/iTable.cfm?ReqID=70&step=1
12 Capital Gains data collected by MassBudget and compiled from official sources including the Tax Expenditure Budget.
13 Wage and Salary data from Bureau of Economic Analysis. Capital Gains data collected by MassBudget and compiled from official sources including the Tax Expenditure Budget.
14 Fundamentally Flawed: 62F Formula Overstates “Excess” by $1.4 Billion. MassBudget. https://massbudget.org/2022/10/05/62f-overstates-excess/
15 62F Credits Benefit the Rich. MassBudget. https://massbudget.org/2022/09/22/62f-credits-benefit-the-rich/


