Public higher education campuses, including the University of Massachusetts (UMass), state universities, and community colleges, play a vital role in our state. Recent data shows that nearly 70 percent of high school graduates who enter higher education study at one of the Commonwealth’s public campuses.1
At its best, the public higher education system in Massachusetts can be an engine for academic, career, and personal growth for students, as well as a pipeline for the next generation of workers and civically-engaged residents.
This report evaluates current proposals to better support campuses and make higher education more affordable, particularly the CHERISH Act (Committing To Higher Education The Resources To Insure A Strong And Healthy Public Higher Education System – Senate Bill 816/House Bill 1260) and the Debt-Free Act (An Act Relative To Debt-Free Public Higher Education – House Bill 1265/Senate Bill 823).
The Importance of Higher Education in Massachusetts
In the modern economy, education beyond high school is increasingly necessary, with a strong share of middle-class jobs requiring that workers obtain a degree after high school. National studies have found that only 20 percent of well-paid middle-class jobs are filled by those with a high school education. Even among entry level jobs, a strong majority currently require training after high school.2 This is particularly true for Massachusetts, where the share of good-paying jobs held by those with four-year degrees is greater than any other state.3
Massachusetts faces challenges that suggest our public campuses will become more important than ever. Declining birthrates, fewer high school graduates completing college, increasing retirements, and families leaving Massachusetts for other states are contributing to a dearth of college-educated workers. An effective and timely way to counter this trend is to increase access to college and boost completion rates, particularly for under-resourced students who face greater challenges accessing higher education. Recent estimates project that the number of college educated workers in Massachusetts will decline by nearly 200,000 by 2030, reversing past growth and placing a significant hurdle in the way of a strong state economy.4
The benefits for students are also clear. Decades of research has shown that economic measures such as future income and earnings, employment rates, and taxes paid all rise significantly along with education level.5 In turn, individuals who have greater access to higher education have greater opportunity to live healthy, engaged lives, and contribute to the well-being of their families and communities.
Public Higher Education in Massachusetts has Faced Underinvestment and Other Challenges
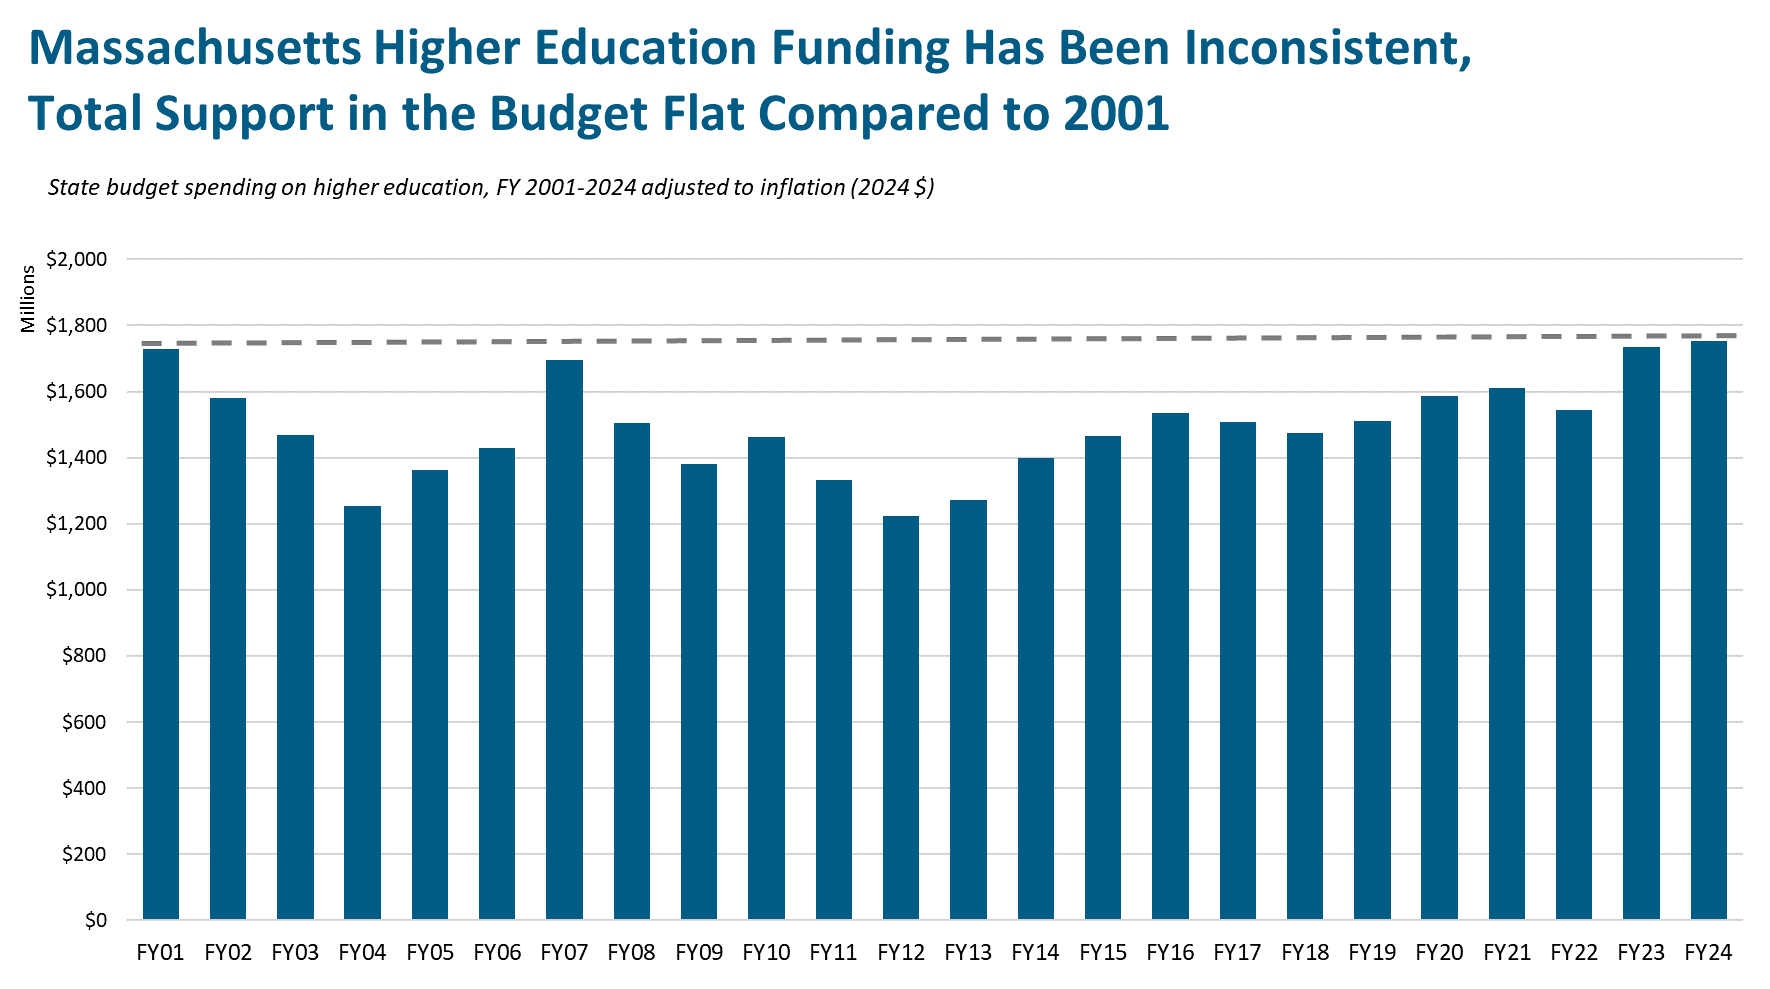
State budget support for public higher education has been inconsistent in the past two decades (see chart below). At the low point in 2012, total higher education funding fell by as much as $500 million (roughly 30 percent) compared to 2001, adjusted for inflation. More recent budget allocations resulted in the state once again reaching (while slightly surpassing) this high watermark in the current 2024 fiscal year.6
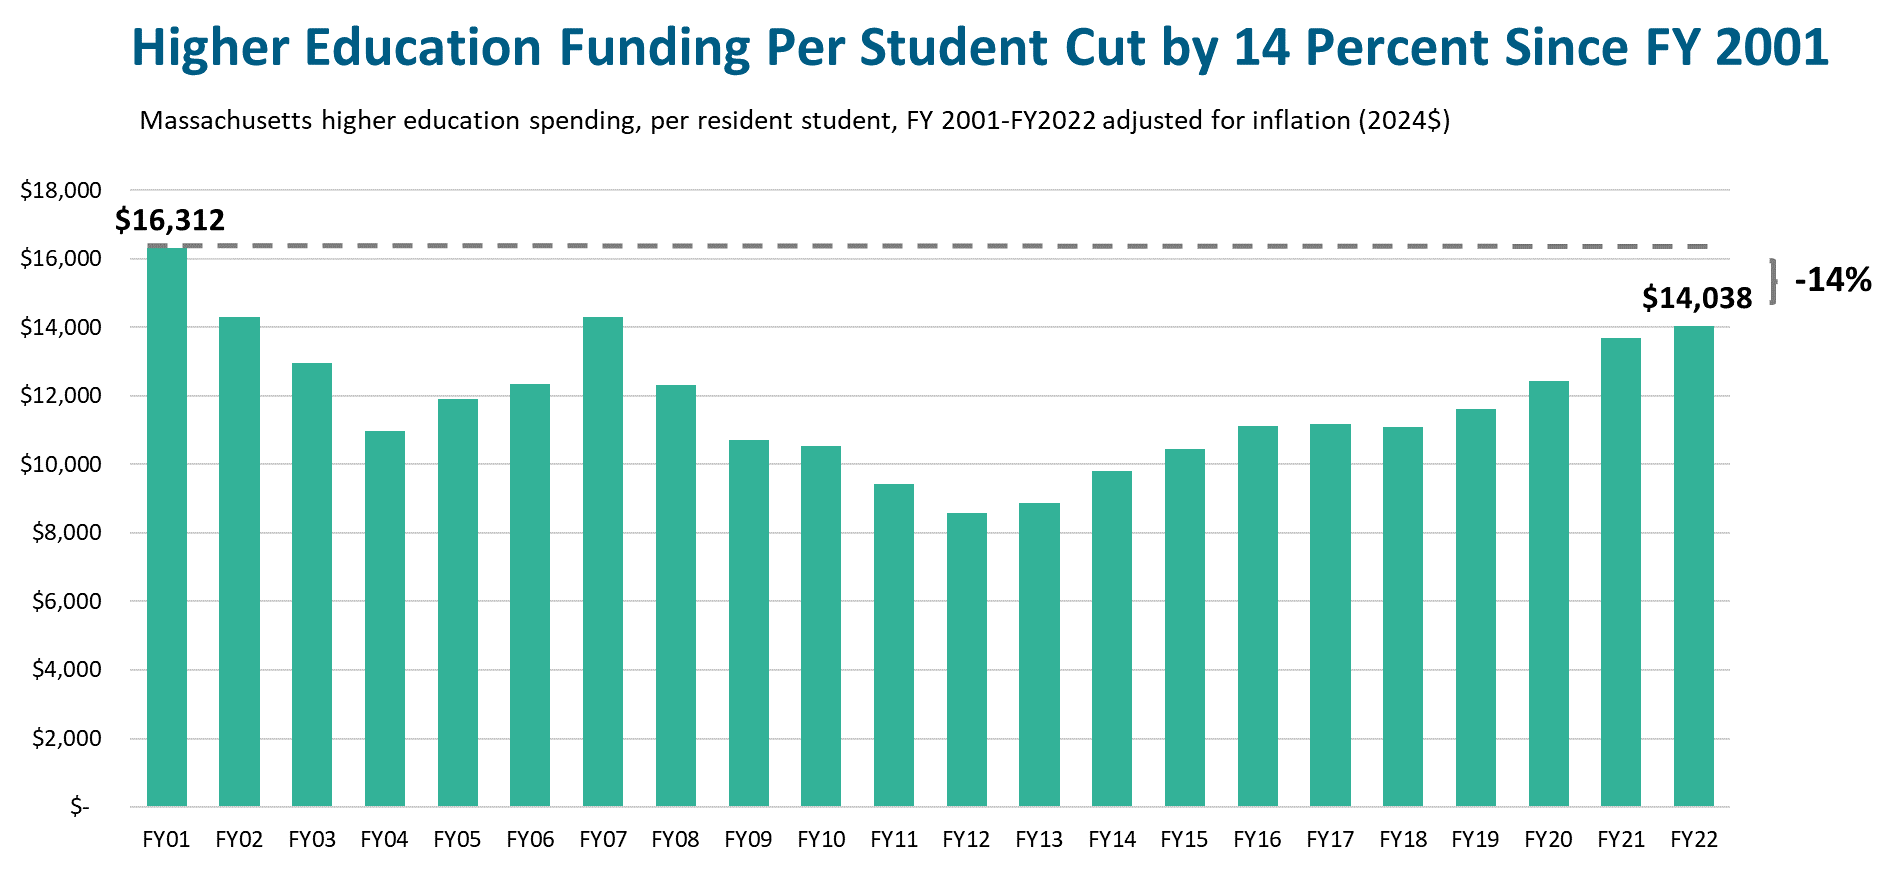
Funding support in the state budget has decreased when considering that UMass, state universities, and community colleges serve 4,000 more resident students than two decades ago. For the most recent year with complete enrollment data (FY 2022), per student funding for higher education decreased by 14 percent (roughly $2,300 per student) since 2001. Looking across the country, Massachusetts lags other states in higher education investment. In 2021, Massachusetts ranked 45th in higher education spending as a share of income, and 34th in per capita higher education investments.7
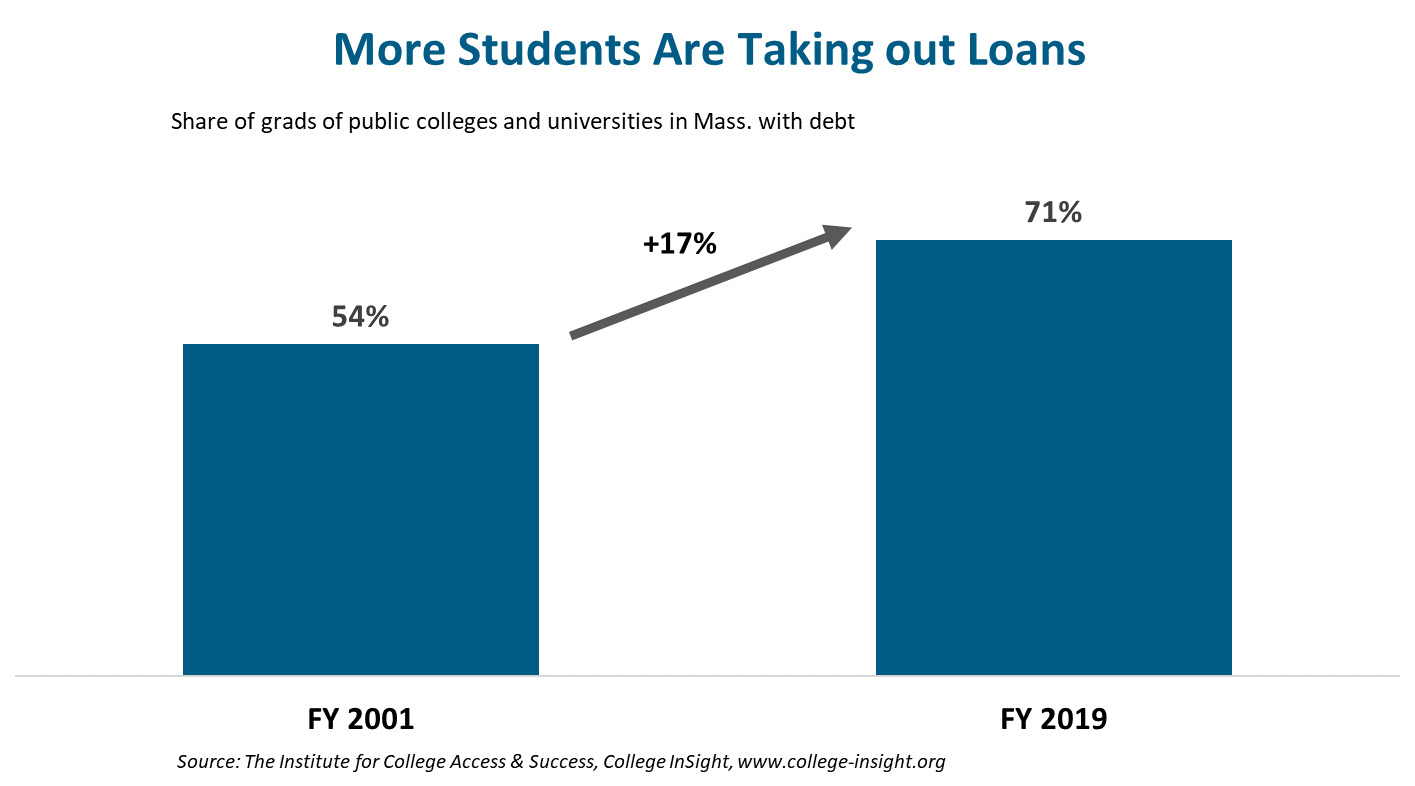
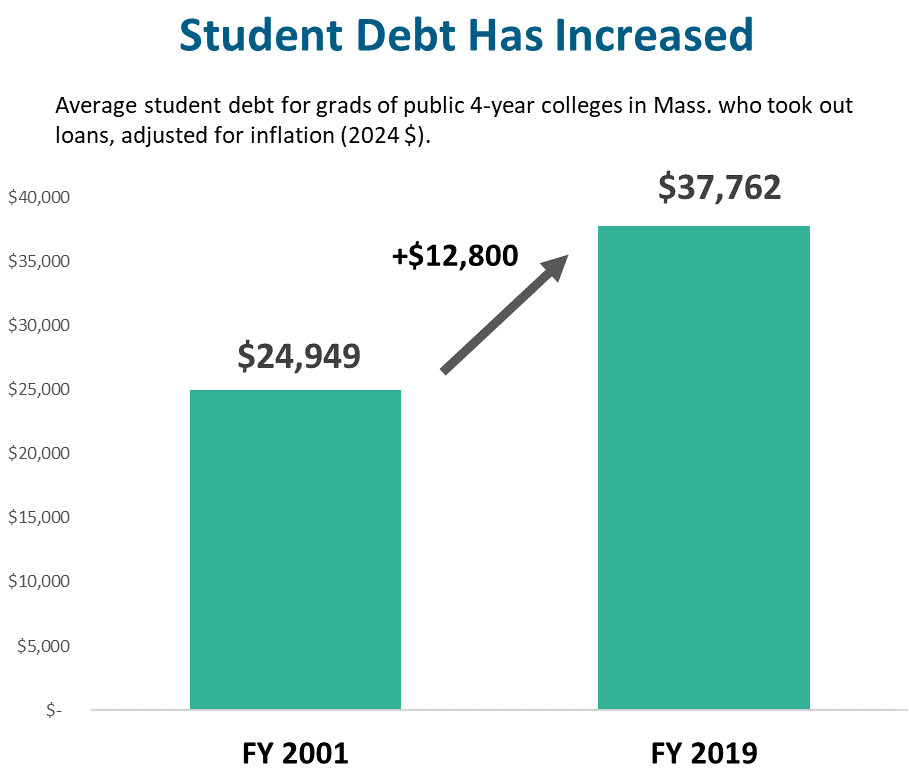
Reduced higher education investments in the Commonwealth’s budget shifted more costs onto students and their families. In the past two decades, there were significant increases in the share of students taking on loans.8 For those students forced to borrow money to pay for their education, the average debt taken on also climbed steeply.
Another important factor behind increasing costs for students and families is the status of campus buildings and related capital debt that needs to be serviced each year. A working group of campus stakeholders and educators found that UMass and state universities have $4.2 billion collectively in capital debt as well as significant deferred maintenance.9 This working group found that capital debt translates to $2,500 per student in increased fees and helps explain about a fifth of the loans students take out to attend public institutions. Providing funding through the state budget and capital plans can help alleviate the pressure to increase student tuition and fees to address the condition of our campuses.
Recent Progress in the Budget for Higher Education
Recently, policymakers have advanced budget and legislative measures that can help reverse these trends, providing better support to campuses and increased affordability for students. The FY 2024 budget, signed during the summer of 2023, includes a handful of important new higher education investments. A total of $234 million is now invested in higher education due to additional revenue from the Fair Share surtax approved by voters on the ballot in 2022.10 These new investments include support for new educational programs, improvements to buildings and infrastructure, as well as a variety of broad-based and targeted scholarships.
One of the new affordability initiatives, MassReconnect, helps community college students over age 25.11 Funds can cover any remaining tuition and fees net of existing aid programs for these students, as well as books and educational supplies. Recent data shows that about 24,600 individual students at community college were over age 25 in 2021.12 That represents 38 percent of community college students and 16 percent of all public undergraduates. The overall cost of MassReconnect, is anticipated to be $20 million (roughly $800 for each student over 25) based on the funding available in the line-item.13 The number of potential students will likely rise as more students learn about the opportunity, a factor that should be considered as the state plans for the cost of the new program.
Other new affordability measures, which received $159 million in total in the FY 2024 budget, include an administrative pilot program for broader free community college efforts, a program for those pursuing degrees in the high-demand nursing field, and a general expansion of state scholarships.14 These incremental steps towards greater affordability pave the way for more comprehensive legislative proposals currently under consideration.
Leading Proposals to Improve Affordability and Increase Investments
Recent budget allocations set the stage for bolder legislative action to ensure that all students and families in the Commonwealth can afford higher education and graduate debt-free. The following section evaluates two of the leading plans under discussion, the CHERISH Act (Committing To Higher Education The Resources To Insure A Strong And Healthy Public Higher Education System – Senate Bill 816/House Bill 1260) and the Debt-Free Act (An Act Relative To Debt-Free Public Higher Education – House Bill 1265/Senate Bill 823).
Each of these pieces of legislation would encourage students of all ages to attend public higher education institutions, while enabling them to avoid the exorbitant debt that many students currently take. Student loan debt detracts significantly from quality of life and financial security. With each of these plans, it is likely that more students would pursue higher education. This would create a more educated workforce, increase earnings, and smooth the path towards life milestones such as homeownership, starting a family, or pursuing graduate level education. In turn, these policies would help increase the economic strength of the entire Commonwealth, resulting in a more affordable and competitive state.
The CHERISH Act
The CHERISH Act is significantly more comprehensive than recent higher education funding policies.15 Leading components and their estimated costs include:
- Creating an expansive scholarship program designed to allow students to graduate without incurring loan debt. Instead of basing scholarships merely on the cost of tuition and fees, it addresses the full cost of attendance (housing, food, transportation, and other living expenses), which nearly always exceed tuition and fees. Costs are reduced by factoring in other existing sources of financial aid, and reasonable contributions from families and students. ($331 million net cost)
- Providing $2,000 per student for support services for historically under-served students, including low-income, disabled, and first-generation students. These types of wraparound services could also include peer mentoring, tutoring, summer enrichment, and advising. ($140 million)
- Establishing state responsibility for costs associated with construction of campus buildings rather than paying these costs from the campus budget or fees paid by students. ($297 million)
- Increasing higher education worker benefits, particularly granting access to health care and pensions for part-time teachers at community colleges. ($22 million)
Based on campus-by-campus analysis using a combination of public sources, federal data, and data provided by the Massachusetts Department of Higher Education, MassBudget estimates the total cost of the CHERISH Act is $790 million (see Appendix II – Methodological Notes).
An important assumption made in these calculations is that wages earned by students during the academic year are treated as separate sources of support for higher education in addition to the expected family contribution (EFC). EFC figures are calculated by higher education institutions and routinely built into student financial aid processes. Factoring student wages into grant calculations, in addition to the family contribution (instead of treating student wages as one part of family contributions), significantly reduces the generosity of the CHERISH Act support for students.
Most of the estimated gross costs of the CHERISH Act would cover tuition, fee, and living costs as well as support services for as many as 70,000 disadvantaged students. Looking at other parts independently, $297 million would be required to assume state responsibility for campus debt service, and an estimated $22 million would be required to add health and pension benefits for part-time teachers within community colleges.16 Long-term analysis of both health and pension trends across higher education would be required to refine these figures moving forward. Benefit costs are likely to increase significantly over time as more workers earn pensions and health care costs rise.
Debt-Free Public Higher Education Act
The second piece of leading legislation for higher education investment, the Debt-Free Public Higher Education Act, also takes a comprehensive approach.17 The leading components of the Debt-Free Act include:
- Establishing free public higher education for all residents as an official state policy.
- Enacting this free higher education policy through an expansive grant equal to tuition and fees at public higher education campuses, net of existing aid programs.
- Providing additional support for low-income students (those eligible for federal Pell grants). This support covers costs of attendance, including room and board, books, supplies, transportation, and other personal expenses.
MassBudget analysis finds that the Debt-Free Act would provide a total of $1.05 billion in new higher education funding if fully implemented. Specifically, this includes $506 million in grants to eliminate tuition and fees. It also includes $539 million in living cost support for roughly 35,000 low-income students to support their broader expenses in pursuing their degrees.
Clearly this would represent a massive increase in support for a group of students who may be particularly unsure whether they can afford to pursue a degree. The aid would especially increase the ability of these students to afford public colleges and universities.
| Comparing the Approaches on Higher Education Investment and Affordability | ||||
|---|---|---|---|---|
| Legislation | Eligibility | Scope | Sector | Annual Cost |
| CHERISH Act | All resident undergraduate students in public higher education | Scholarships that cover the cost of attendance including living costs after other sources of aid and funds are factored in. Additional grants for disadvantaged students Increased benefits for adjunct faculty Greater state responsibility for funding campus building infrastructure | Community Colleges, State Universities, UMass | $790 million $22M in teacher benefits $296M in capital building funds |
| Debt-Free Public Higher Education Act | All resident undergraduate students in public higher education | Grants equal to tuition and mandatory fees Additional grant for low-income students to cover costs of attendance/living expenses | Community Colleges, State Universities, UMass | $1.05 billion $506M in grants to cover tuition and fees, $539M to cover living costs for low-income students |
Evaluating the Approaches & Moving Forward
Both the CHERISH Act and the Debt-Free Act would dramatically improve the ability of many students to make ends meet and thrive as they pursue degrees at public colleges and universities, while counteracting the rise of student indebtedness and underinvestment in higher education. However, the two plans do have differing strengths.
In addition to improving student affordability, the CHERISH Act represents a broad approach to addressing the financial strains facing higher education. This includes improving working conditions for faculty and increasing state support for campus buildings and infrastructure.
Conversely, the CHERISH Act is less generous on a per pupil basis than the Debt-Free Act ($7,300 compared to $9,600). There is also wide variation in the amount of per pupil support for campuses under the plan, largely due to wide differences in tuition and non-tuition costs, the socio-demographic composition of different campuses, as well as the expected contribution from families. The range is from $1,700 in support at one campus to over $20,000 per pupil at another. When measured as a share of total cost of attendance, the CHERISH program benefits range from 10 percent to 54 percent of costs covered, depending on the campus.
As mentioned above, the Debt-Free Act provides the most total and per pupil aid, making it the more generous plan. It is also more evenly applied across all campuses. The range of per student support ranges from $4,500 per student to $14,600 at the top end. These grants would cover between 25 percent and 47 percent of all costs of attendance, another indicator of more evenly distributed support. The Debt-Free Act’s approach of creating the grants based on tuition and fee costs, with living costs added for low-income students (without removing support based on family and student ability to contribute) helps explain the more even distribution. This design might also make implementation of the grant more straightforward. That being said, the Debt-Free Act leaves key issues unaddressed, such as faculty working conditions and capital maintenance, therefore making it a less comprehensive plan. Moving forward, it will be possible to combine the best elements of each of these leading plans for higher education reinvestment.
Both the CHERISH Act and Debt-Free Act also have the potential to significantly advance racial equity in Massachusetts by directing resources in ways that counter historical and ongoing legacies of racism. While helping all students, the campus-level distribution of funding, especially among community colleges and UMass campuses, suggests that these plans would also direct funds in a way that would help to address racial inequities.
Assuming benefits flow to different racial categories of students proportionately based on enrollment, roughly half of the benefits to community college students from the CHERISH Act and Debt-Free Act would assist students of color (African American, American Indian, Asian and Pacific Islander, Latino and Multi-Racial students). This significantly exceeds the number of people of color in the population at large (21 percent), as well as the share of all undergraduates in Massachusetts (36 percent – including private and for-profit schools, as well as public institutions).18 The same would be true for the benefits of CHERISH and Debt-Free for UMass students (see tables in Appendix I below). For State Universities, the benefits of CHERISH and Debt-Free would flow to people of color more than their share of the Commonwealth’s population but somewhat less than their share of the undergraduate population. Future analysis can help further study these trends.
Due to limitations in the availability of data, the degree to which these two plans would advance racial equity is likely understated in the estimates below. In practice, historical discrimination and structural barriers facing students of color mean these students would likely be over-represented among those with lower-incomes and expected family contributions who would receive additional support.
By building on higher education investments made possible by the Fair Share surtax funds in FY 2024, elected leaders have a once-in-a-generation chance through legislation like the CHERISH Act and Debt-Free Act to make the Commonwealth more affordable and more competitive. Investments that allow all residents of the Commonwealth to attend outstanding public institutions in an affordable manner would enhance our knowledge-driven economy, as well as improve overall well-being in our state now and for generations to come.
Appendix I – Estimated Benefits of Higher Education Legislation by Race and Public Higher Education Segment
| Community Colleges | |||
|---|---|---|---|
| Race | Share of undergraduate enrollment (Share of Mass. population) | Net Benefits of CHERISH Act (% of total) | Net Benefits of Debt Free Act (% of total) |
| African American/Black | 9.5% (9.5%) | $27M (15.8%) | $39M (15.4%) |
| American Indian/Native American | 0.4% (0.2%) | $0.3M (0.2%) | $0.5M (0.2%) |
| Asian + Pacific Islander | 8.8% (7.7%) | $11M (6.3%) | $15M (5.8%) |
| Latino | 13.5% | $46M (26.4%) | $63M (24.4%) |
| Multi-Racial | 3.8% (2.7%) | $6M (3.2%) | $9M (3.5%) |
| White | 50.2% (79.4%) | $72M (41.5%) | $113M (44.2%) |
| State Universities | |||
|---|---|---|---|
| Race | Share of undergraduate enrollment (Share of Mass. population) | Net Benefits of CHERISH Act (% of total) | Net Benefits of Debt Free Act (% of total) |
| African American/Black | 9.5% (9.5%) | $24M (9.0%) | $33M (9.5%) |
| American Indian/Native American | 0.4% (0.2%) | $0.9M (0.3%) | $1M (0.3%) |
| Asian + Pacific Islander | 8.8% (7.7%) | $9M (3.4%) | $12M (3.4%) |
| Latino | 13.5% | $38M (14.1%) | $52M (14.8%) |
| Multi-Racial | 3.8% (2.7%) | $12M (4.3%) | $14M (4.1%) |
| White | 50.2% (79.4%) | $174M (64.5%) | $224M (64.1%) |
| University of Massachusetts System | |||
|---|---|---|---|
| Race | Share of undergraduate enrollment (Share of Mass. population) | Net Benefits of CHERISH Act (% of total) | Net Benefits of Debt Free Act (% of total) |
| African American/Black | 9.5% (9.5%) | $46M (14.3%) | $48M (10.9%) |
| American Indian/Native American | 0.4% (0.2%) | $0.3M (0.1%) | $0.4M (0.1%) |
| Asian + Pacific Islander | 8.8% (7.7%) | $51M (14.8%) | $62M (14.1%) |
| Latino | 13.5% | $55M (15.7%) | $61M (13.9%) |
| Multi-Racial | 3.8% (2.7%) | $15M (4.3%) | $19M (4.3%) |
| White | 50.2% (79.4%) | $180M (51.8%) | $250M (56.7%) |
Appendix II – Methodological Notes
General
- All state budget funding totals are adjusted to FY 2024 (current fiscal year) dollars, unless otherwise noted, using data from the Consumer Price Index (CPI).
- Higher education enrollment data is from the Department of Higher Education and UMass Office of Institutional Research. All enrollment figures are in full-time equivalent students (FTE) unless otherwise noted.
Cost of Attendance (COA)
- Currently, there is no standard methodology for determining the cost of attendance (COA) across Massachusetts public institutions. There are a variety of sources for COA data in the field. However, concrete estimates for the cost of attendance at each public campus are essential to understand the fiscal impact of legislation such as the CHERISH Act and the Debt-Free Act. This study uses the best possible data from each institution itself, published on their respective websites, as well as some supplementary data from the Massachusetts Department of Higher Education.
Several public higher education campuses, particularly community colleges, have tools called “net price calculators” on their websites to estimate COA. In these cases, MassBudget used a standard assumption of a single, independent student, aged eighteen, applying for financial aid, within a family of four including parents and one non-college-age sibling. Assumed family income was set to the median of the options available on the calculator, typically between $60,000 and $70,000. Because only COA data was used in the analysis, family income and its effect on financial aid (part of determining the net price of attendance) is not likely to be a factor in this data.
External sources or aggregators of COA data were used in several cases as a backup option where there were significant flaws or inconsistencies in the data, or where data was excessively out-of-date.
The costs of early education, childcare, and after-school care, a major cost for higher education students with dependent children, are not included in this COA methodology. This report therefore assumes early education and care policy and budget deliberations will proceed in their own arena. However, that process would benefit from appropriate coordination with higher education policies, especially related to affordability, to ensure that lack of affordable, reliable childcare does not impede students from being able to pursue a higher education degree. That is clearly a significant issue facing students today. - Massachusetts Maritime Academy (MMA), a special mission state university, with a variety of marine trade majors, has a particularly complex COA. To provide a reasonable estimate of COA at MMA, MassBudget selected a single program of study (Marine Transportation) and used the COA of that major as a stand-in for all MMA students. These costs include typical expenses such as room, board, books etc. as well specific marine supplies and equipment necessary for this unique experiential learning environment. Future analysis could add additional precision to understanding of COA at MMA by examining all majors of study and their unique costs across four-year programs of study.
Cost Estimates of the CHERISH Act and Debt-Free Act
- The cost estimates of the CHERISH Act and Debt-Free Act assume that the legislation targets in-state resident Massachusetts undergraduate students. The enrollment methodology discussed above removes out-of-state students at the University of Massachusetts, but not at state universities or community colleges where out-of-state enrollment is less significant. Future analysis could address this issue universally to add additional precision to the estimates.
- Data on the share of students eligible for Pell Grants, which is also the proxy for estimating the number of low-income students in higher education, is derived from the National Center for Education Statistics (NCES) Integrated Postsecondary Data System (IPEDS) figures on Massachusetts public institutions. The most recent complete data on the share of Pell students at each campus is from 2021. This share is applied to the most updated enrollment data from 2022-2023 to estimate the number of Pell-eligible (and low-income) students for the cost estimates of the CHERISH Act and Debt-Free Act.
- Data on students with disabilities is based on federal Integrated Postsecondary Data System (IPEDS) figures on Massachusetts public institutions. The most recent complete data on the share students with disabilities at each campus is from 2021. In one case, UMass Dartmouth, the data on students with disabilities was reported in the IPEDS database as “less than 3%.” The figure was subsequently set to a midpoint of 1.5 percent for the purposes of calculation. The share of students with disabilities is applied to the most updated enrollment data from 2022-2023 to estimate the number of students with disabilities for projecting the cost of the CHERISH Act.
- Data on first-generation students (first in their family to attend college) is derived from the NCES Baccalaureate & Beyond Longitudinal Survey. This survey data was refined to focus on public institutions and students without college-going parents or siblings. Due to a small sample size, the survey results are for public campuses nationally, not just those in Massachusetts. The sample estimate of students without college-going parents or siblings (of 23%) was applied to all Massachusetts public campuses to create rough estimate of first-generation students at each campus for the cost estimates of the CHERISH Act. A more detailed Massachusetts-specific analysis of the first-generation population in public higher education and the differences between campuses would add significantly more precision to these estimates.
- Estimated costs for support services (such as advising and tutoring) for disadvantaged undergraduates in the CHERISH Act is derived by multiplying the $2,000 per-student allocation in the CHERISH legislation, times the estimated populations of low-income (Pell-eligible students), students with disabilities, and first-generation students. This calculation method results in students who fit in multiple categories being counted more than once for $2,000 allocations. In practice, students facing multiple disadvantages would likely need additional support resources. In addition, support services are likely to be administered on a campus-wide basis using all the allocated funds and meet students where they are based on their holistic needs.
- Data on existing sources of federal, state, institutional or other grants (amounts which would not need to be covered by affordability measures such as those in the CHERISH Act and Debt Free Act) is based on federal Integrated Postsecondary Data System (IPEDS) figures on Massachusetts public institutions. The most recent complete grant data for each campus is from 2021. The aggregate amount, netted out of the costs of both CHERISH and Debt-Free, is $751 million.
- Estimated capital and construction related costs that would be assumed by the Commonwealth under the CHERISH Act are from the Campus Debt Reveal Project 2022 report (see also works cited below). This working group of higher education professors, students, and labor organizations found a total of $297 million in annual debt service payments across thirteen campuses. These costs were limited to UMass and state universities, however, the researchers did find significant deferred maintenance at community colleges.
For the purposes of the CHERISH Act cost estimate, these campus level costs were assigned to the total cost of the legislation at the affected campuses and thus included in the statewide costs of the CHERISH Act. Further study could help clarify the scope of debt service payments across the higher education sector, including whether and how community colleges are affected. - Estimated costs for health and pension benefits for adjunct/part-time faculty were derived from the April 2023 MassINC Report “Getting Question 1 Right: Investment Options for Equity in Public Higher Education” (see also works cited below). This study found that adjunct/part-time faculty health and pension benefits for community college faculty would cost $22 million in FY 2024. This is a rough estimate at best and is not derived from a comprehensive study of the issue, which would enhance the precision of future estimates. For this report, the cost of the CHERISH Act applies the $22 million figure to community college campuses based on their share of enrollment in that sector. In general, employing adjunct faculty is more prevalent at community colleges compared to state universities and UMass, however, further study on these issues is critical for a better understanding of this aspect of higher education policy.
- Expected family contribution (EFC) data (totaling $1.32 billion statewide) used in the CHERISH Act cost estimate is based on a dataset provided to MassBudget by the Department of Higher Education (DHE) on request in 2020, but which reflects the situation of families in 2018. MassBudget is currently in the process of working with DHE to provide updated figures for EFC across the state. This aspect of the CHERISH Act estimate will be updated as soon as possible. As it stands the EFC figures reflect holding family contributions at levels of at least five years ago. Data limitations aside, it may be preferable to implement caps on EFC or otherwise reduce the share of gross benefits from CHERISH or similar policies that are netted out or covered by students and families in higher education to make them more generous.
- Student wages used in the CHERISH Act cost projection are based on a simplified assumption that all students work 36 weeks throughout the year, for 10 hours weekly, at the current state minimum wage of $15 per hour. This results in a total statewide estimate of $586 million in student wages that would be available for students to support living expenses. In practice, several factors could push the actual incidence of student wages and earnings up or down. Students could feasibly work additional hours or earn higher wages than this estimate. However, some students may not earn as much income as assumed here. This estimate also does not factor in payroll deductions.
- The cost estimates of the CHERISH Act utilize the data discussed above as part of the following calculation at each public higher education campus, which is then aggregated to an entire statewide cost estimate:
- Cost of Attendance * undergraduate enrollment
- – Existing federal, state, and institutional grants
- – Expected family contribution
- – Estimated student wages
- + ($2,000 * [low-income students + students with disabilities + first generation students])
- + Campus debt-service costs
- + Estimated adjunct faculty benefit costs
- = Resulting cost estimate of $789,764,910 ($7,279/student)
- Cost of Attendance * undergraduate enrollment
- The resulting cost estimate of the CHERISH Act presents data aggregated at the campus level, as that is the greatest level of detail at which data is currently available. Campus level aggregation results in eight campuses with no estimated net benefits for the COA affordability grant component of CHERISH. In practice, the factors of cost of attendance, as well as existing financial aid, expected family contribution, and student wages, would vary at the individual student level. Even where a campus-wide estimate shows zero net COA/affordability grant benefits, in practice at the individual level, some students would qualify for such a grant under the CHERISH Act. Further detailed study at the individual student level would be required to estimate the full practical cost of the CHERISH Act for all students in higher education with greater detail than is possible with a campus-level estimate.
- The cost estimate of the Debt-Free Act utilizes the data discussed above as part of the following calculation at each public higher education campus, which is then aggregated to an entire statewide cost estimate:
-
- (FY 2023 tuition & fees * undergraduate enrollment)
- – Existing federal, state, and institutional grants
- + ([Cost of Attendance – FY 2023 Tuition & Fees] * Pell-eligible (low-income) students
- = Resulting cost estimate of $1,045,265,331 ($9,634/student)
-
Impact of the CHERISH Act and Debt-Free Act by Race at Community Colleges, State Universities, and UMass (see Appendix I)
- Analysis of the distribution of benefits from the CHERISH Act and Debt-Free Act is based on public data on the racial demographics of each public higher education campus from the Department of Higher Education and University of Massachusetts Office of the President Institutional Research Reports. Racial demographic data is not available for all students across higher education. Additionally, perhaps due to federal reporting requirements, some higher education data includes the category “Non-Resident Alien” as a racial group within its demographic breakdowns of institutions by race. Because no data on the race of these students is provided apart from their citizenship status, they are not included in the racial impact analysis. In some cases, these students are included in the overall headcount to ensure totals can be properly calculated.
- DHE and UMass data on the racial backgrounds of all students in higher education was used to proportionately distribute the estimated benefits from CHERISH Act and Debt-Free Act for each campus, which was then be aggregated by segment of higher education. For example, if the population of Asian students at a community college campus was 10 percent, one-tenth of the benefits of each piece of legislation was apportioned to Asian students at that campus, and then further to an overall total for community colleges in this analysis. This provides an approximation of the racial impact of these policies.
Only implementing these plans and evaluating the students applying for specific grant programs and their backgrounds would provide exact figures on the impact for different students. Based on historical legacies of racism and other structural factors, students of color are almost certainly over-represented among low-income, first-generation, and other demographics that would tend to require more aid to cover tuition, fees, and other cost of attendance and have less family capacity to contribute. That suggests the racial impact analysis here represents a floor on the equity impact of CHERISH and Debt-Free. - Comparisons between the impacts of higher education legislation and the population of Massachusetts uses United States Census Bureau Quick Facts for the overall population of Massachusetts (see also works cited below). Data for comparing impacts to the demographics of the entire undergraduate population in Massachusetts is based on federal Integrated Postsecondary Data System (IPEDS) data. The most recent year of this data is 2021. The IPEDS data includes undergraduates from all types of institutions (including private, public, non-profit, and for-profit institutions). Comparing specific investments in public higher education to any other affecting the population of the Commonwealth (overall population) and the college-going population (undergraduates) provide relevant benchmarks, but other analyses to further contextualize the impact of specific higher education policies could add value to the debate moving forward.
Works Cited
1 “2020-21 Graduates Attending Institutions of Higher Education – All Students – All Colleges and Unviersities.” Department of Elementary and Secondary Education. 2022.
https://profiles.doe.mass.edu/statereport/gradsattendingcollege.aspx
2 In this particular study, good (middle-class) jobs are defined as those with median wages of roughly $84,000 per year in current dollars for workers aged 25-64. For further detail see:
Anthony P. Carnevale, Jeff Strohl, Neil Ridley and Artem Gulish. “Three Educational Pathways to Good Jobs: High School, Middle Skills, and Bachelor’s Degree.” Georgetown University Center on Education and the Workforce. 2018. pgs 2-3. https://cew.georgetown.edu/wp-content/uploads/3ways-FR.pdf
3 Anthony P. Carnevale, Jeff Strohl, and Neil Ridley. “Good Jobs That Pay Without a BA: A State-by-State Analysis.” Georgetown University Center on Education and the Workforce. 2017. pg 13 http://cew.georgetown.edu/wp-content/uploads/CEW-Good-Jobs-States.pdf
4 Ben Forman and Simone Ngongi-Lukula. “Sizing Up Massachusetts’ Looming Skilled-Worker Shortage. MassINC. 2022. pgs. 1-5 https://massinc.org/research/sizing-up-massachusetts-looming-skilled-worker-shortage
5 Jennifer Ma and Matea Pender. “Education Pays 2023. The Benefits of Higher Education for Individuals and Society. College Board. 2023. pgs. 17, 29, 37, 39, 41. https://research.collegeboard.org/media/pdf/education-pays-2023.pdf
6 MassBudget Budget Browser. Higher Education – Adjusted for Inflation (CPI). 2023.
https://massbudget.org/budget-browser/subcategory/?id=Higher+Education&inflation=cpi
7 “ State Fiscal Support for Higher Education Per $1,000 in Personal Income and Per Capita, FY16, FY19, FY20, FY21.”. Illinois State University College of Education – Grapevine. 2023.
https://education.illinoisstate.edu/downloads/grapevine/tables/fy21/GPV_Table4_FY21.xlsx
8 “Massachusetts – Public – Average Debt of Graduates and Percentage of Graduates with Debt. 2000-2001 and 2018-2019.” The Institute for College Access & Success. College Insight Data Center. Figures adjusted to inflation (2023-2024). https://www.college-insight.org/explore
9 Joanna Gonsalves, Rich Levy, Gayathri Raja, and Tyler Risteen. “Campus Debt Reveal 2022” Massachusetts Campus Debt Reveal Project. 2022
https://salemmscadocs.home.blog/massachusetts-campus-debt-reveal-project-spring-2022/
Yawu Miller. “UMass Students Carry School Debt.” Bay State Banner. September 21, 2022.
https://www.baystatebanner.com/2022/09/21/umass-students-carry-schools-debt/
10 Jason Wright. “Your Fair Share Dollars at Work: Critical Investments and Hard Choices. MassBudget. 2023. pgs 1-2 https://massbudget.org/wp-content/uploads/2023/08/FSA-at-Work-Critical-Investments-and-Hard-Choices-FINAL_endnotes_8.15.23.pdf
11 193rd General Court of the Commonwealth of Massachusetts. “FY 2024 Budget. Governor’s Budget.” Pgs 238-239. Governor’s Budget pgs 238-239 https://malegislature.gov/Budget/GovernorsBudget
“FY 2024 Budget. House Budget.” pg. 233. https://malegislature.gov/Budget/FY2024/HouseBudget
“FY 2024 Budget. Senate Budget. pgs. 365-366 https://malegislature.gov/Budget/FY2024/SenateBudget
12 MassBudget Analysis of Integrated Posecondary Education Data System (IPEDS) Data. National Center on Education Statistics. IPEDS. 2023. https://nces.ed.gov/ipeds/datacenter/Data.aspx
13 Jason Wright. “How Will We Spend Fair Share Dollars? Competing Proposals Highlight Needs and Opportunities.” MassBudget. 2023. https://massbudget.org/2023/06/02/fsa-spending-proposals-comparison/
14 Jason Wright. “Your Fair Share Dollars at Work: Critical Investments and Hard Choices. MassBudget. 2023. pgs 4-5 https://massbudget.org/wp-content/uploads/2023/08/FSA-at-Work-Critical-Investments-and-Hard-Choices-FINAL_endnotes_8.15.23.pdf
16 Joanne Comerford, Patricia A. Duffy, and Sean Garballey. “An Act Committing to Higher Education the Resources to Insure a Strong and Healthy Public Higher Education System.” 193rd General Court of the Commonwealth of Massachusetts. 2023. https://malegislature.gov/Bills/193/S816
16 Joanna Gonsalves, Rich Levy, Gayathri Raja, and Tyler Risteen. “Campus Debt Reveal 2022” Massachusetts Campus Debt Reveal Project. 2022. pg. 9.
https://salemmscadocs.home.blog/massachusetts-campus-debt-reveal-project-spring-2022/
Ben Forman and J. Oliver Schak. “Getting Question 1 Right: Investment Options for Equity in Public Higher Education. MassINC. 2023. pg 18. https://massinc.org/research/getting-question-1-right-investment-options-for-equity-in-public-higher-education/
17 James B. Eldridge, Carmine Lawrence Gentile, and Natalie M. Higgins. “An Act Relative to Debt Free Higher Education. 193rd General Court of the Commonwealth of Massachusetts. 2023 https://malegislature.gov/Bills/193/H1265
18 MassBudget Analysis of Integrated Posecondary Education Data System (IPEDS) Data. National Center on Education Statistics. IPEDS. 2023. https://nces.ed.gov/ipeds/datacenter/Data.aspx
United States Census Bureau. “Quick Facts – Massachusetts.” 2022 https://www.census.gov/quickfacts/fact/table/MA/AGE295222


