
Summary
The 2019 Student Opportunity Act (SOA) intended to make state funding in K-12 schools more robust and equitable. The following analysis examines the SOA’s impact on K-12 funding so far. It also examines how recent inflation levels have dampened the impact of the new law and what the Commonwealth can do to address the actual costs faced by schools and districts.
The Promise of the Student Opportunity Act
When K-12 students across the Commonwealth receive sufficient resources, opportunities, and support to reach high levels of educational achievement, it benefits everyone. Creating an education system where all students, regardless of their background, can reach academic, career, and life success plays a significant role in creating a vibrant economy and democracy in Massachusetts.
After more than a decade of calls to update the state education funding formula known as Chapter 70, in 2019 Massachusetts achieved the first comprehensive update to K-12 funding in 26 years through the passage of the Student Opportunity Act (SOA) law.1
The SOA was centered around the equitable modernization of school finance and state support for local schools. It was originally projected to add $1.5 billion in Chapter 70 aid to schools across the state.2 The changes in the SOA were informed by the Foundation Budget Review Commission of 2014-2015, which identified significant shortfalls in K-12 funding and potential solutions. Key components included:
- Increased funding rates for low-income students to a maximum of roughly 100 percent of typical funding for districts with the most low-income students. This doubling of funding rates in the formula supports additional services and support for disadvantaged students.
- Increased funding rates for English Language Learners, particularly those in high school, to provide additional support for these students to gain English skills.
- Modernized costs for several elements of the Chapter 70 formula that had fallen significantly behind actual costs, including health care for educators and funding rates for special education students.
- Several funding initiatives outside of the main Chapter 70 aid program. This includes fully-funded reimbursement grants for districts to cover the transitional costs of students departing to charter schools, increased grants for special education transportation, increased school building funds, and an innovation grant to support cutting-edge practices in schools.
The Student Opportunity Act largely left in place existing measures to track student success and performance, which had been updated more recently than the school finance system. However, the SOA added a requirement for districts to develop and publish 3-year-plans on how SOA funds would be implemented and benchmarks for evaluating the impact of new programs.3 The law also included a data advisory commission to help the Department of Elementary and Secondary Education (DESE) evaluate how districts are supporting young people in being ready for higher education and the workforce.
Progress and Challenges in SOA Implementation
Since the passage of this landmark law in 2019, Massachusetts has experienced some unexpected hurdles in carrying out the plan. Remarkably, the state has largely stayed on the intended path of increased and equitable investment in schools. The largest obstacle was the onset of the COVID-19 pandemic in 2020. This resulted in the delay of the first year of the SOA in FY 2021 and a decline of over $230 million in Chapter 70 aid to districts, particularly for those serving large populations of low-income students.4 This gap was ultimately filled by federal COVID relief funds. After several rounds of support, federal COVID relief funds for schools exceeded the expected funding from the SOA. However, these funds were somewhat focused on mitigating the specific problems of the pandemic, and were also temporary, with funding set to run out in 2024.5
Since FY 2022, the Commonwealth has met its annual obligation to implement the Student Opportunity Act. Instead of delaying the plan due to the pandemic, the target has remained consistent with the intent of the law to complete implementation of the SOA in FY 2027. 6
However, another critical problem arose in the first years of the Student Opportunity Act that has yet to be addressed. Recent high levels of inflation and cost growth have had dire impacts on operating costs for schools. The factors in the Commonwealth’s current funding formula (such as for educators, supplies, materials, and support services) are increased each year by an inflation factor that draws from the recent cost growth for state and local governments.7 However, this factor is capped (through a decades-old state law) at a maximum of 4.5 percent annually. This fails to reflect the reality of recent inflation.
The two most recent fiscal years, FY 2023 and FY 2024, had levels of inflation that exceeded the cap, reaching roughly 7 percent and 8 percent. In each of these years, the Commonwealth operated with the capped maximum of 4.5 percent, leading to a gap of roughly 6 percentage points collectively over two years.8 As it stands, the current formula is shortchanging the value of the SOA reforms relative to the cost growth now being incurred by Massachusetts schools, contributing to budgetary challenges and shortfalls. Two hundred and nineteen school districts are slated to receive less funding for the coming year than they would with a complete inflation adjustment, an issue that will carry into future allocations and imperil services for students until it is addressed. The average funding gap from unaddressed inflation for these districts is $2.1 million, but the amounts vary greatly across districts – with a maximum of over $28 million in Springfield to just $19,000 in Eastham and Rochester. See a list of each district HERE.
K-12 Funding Projections
To evaluate how our K-12 funding system is faring under the SOA and the magnitude of the problems caused by underinflating school funding levels, MassBudget created several projections of the Chapter 70 school aid system. Primarily, these simulations are focused on three scenarios.
The first scenario tracks the state aid that would have occurred without passage of the SOA; the second looks at the SOA if it continues to be implemented as it has been so far; and the third demonstrates what funding levels would be if the past two years of missed inflation was fully incorporated into the formula.
For this analysis, key factors in future years are held in line with the most recent trends (such as enrollment, current FY 2025 inflation levels, and minimum per-pupil increases of at least $30 that are typically provided to all districts regardless of the fundamentals of the formula). Additionally, for FY 2025, the figures for scenario two (the current track of implementing the SOA) are based on the Governor’s January 2024 proposal. The House and Senate added at least $45 million through their budget proposals, but did not make the full details of these changes available to allow direct comparison, especially at the district level.9
Scenario One – SOA has Increased K-12 Funding in an Equitable Way
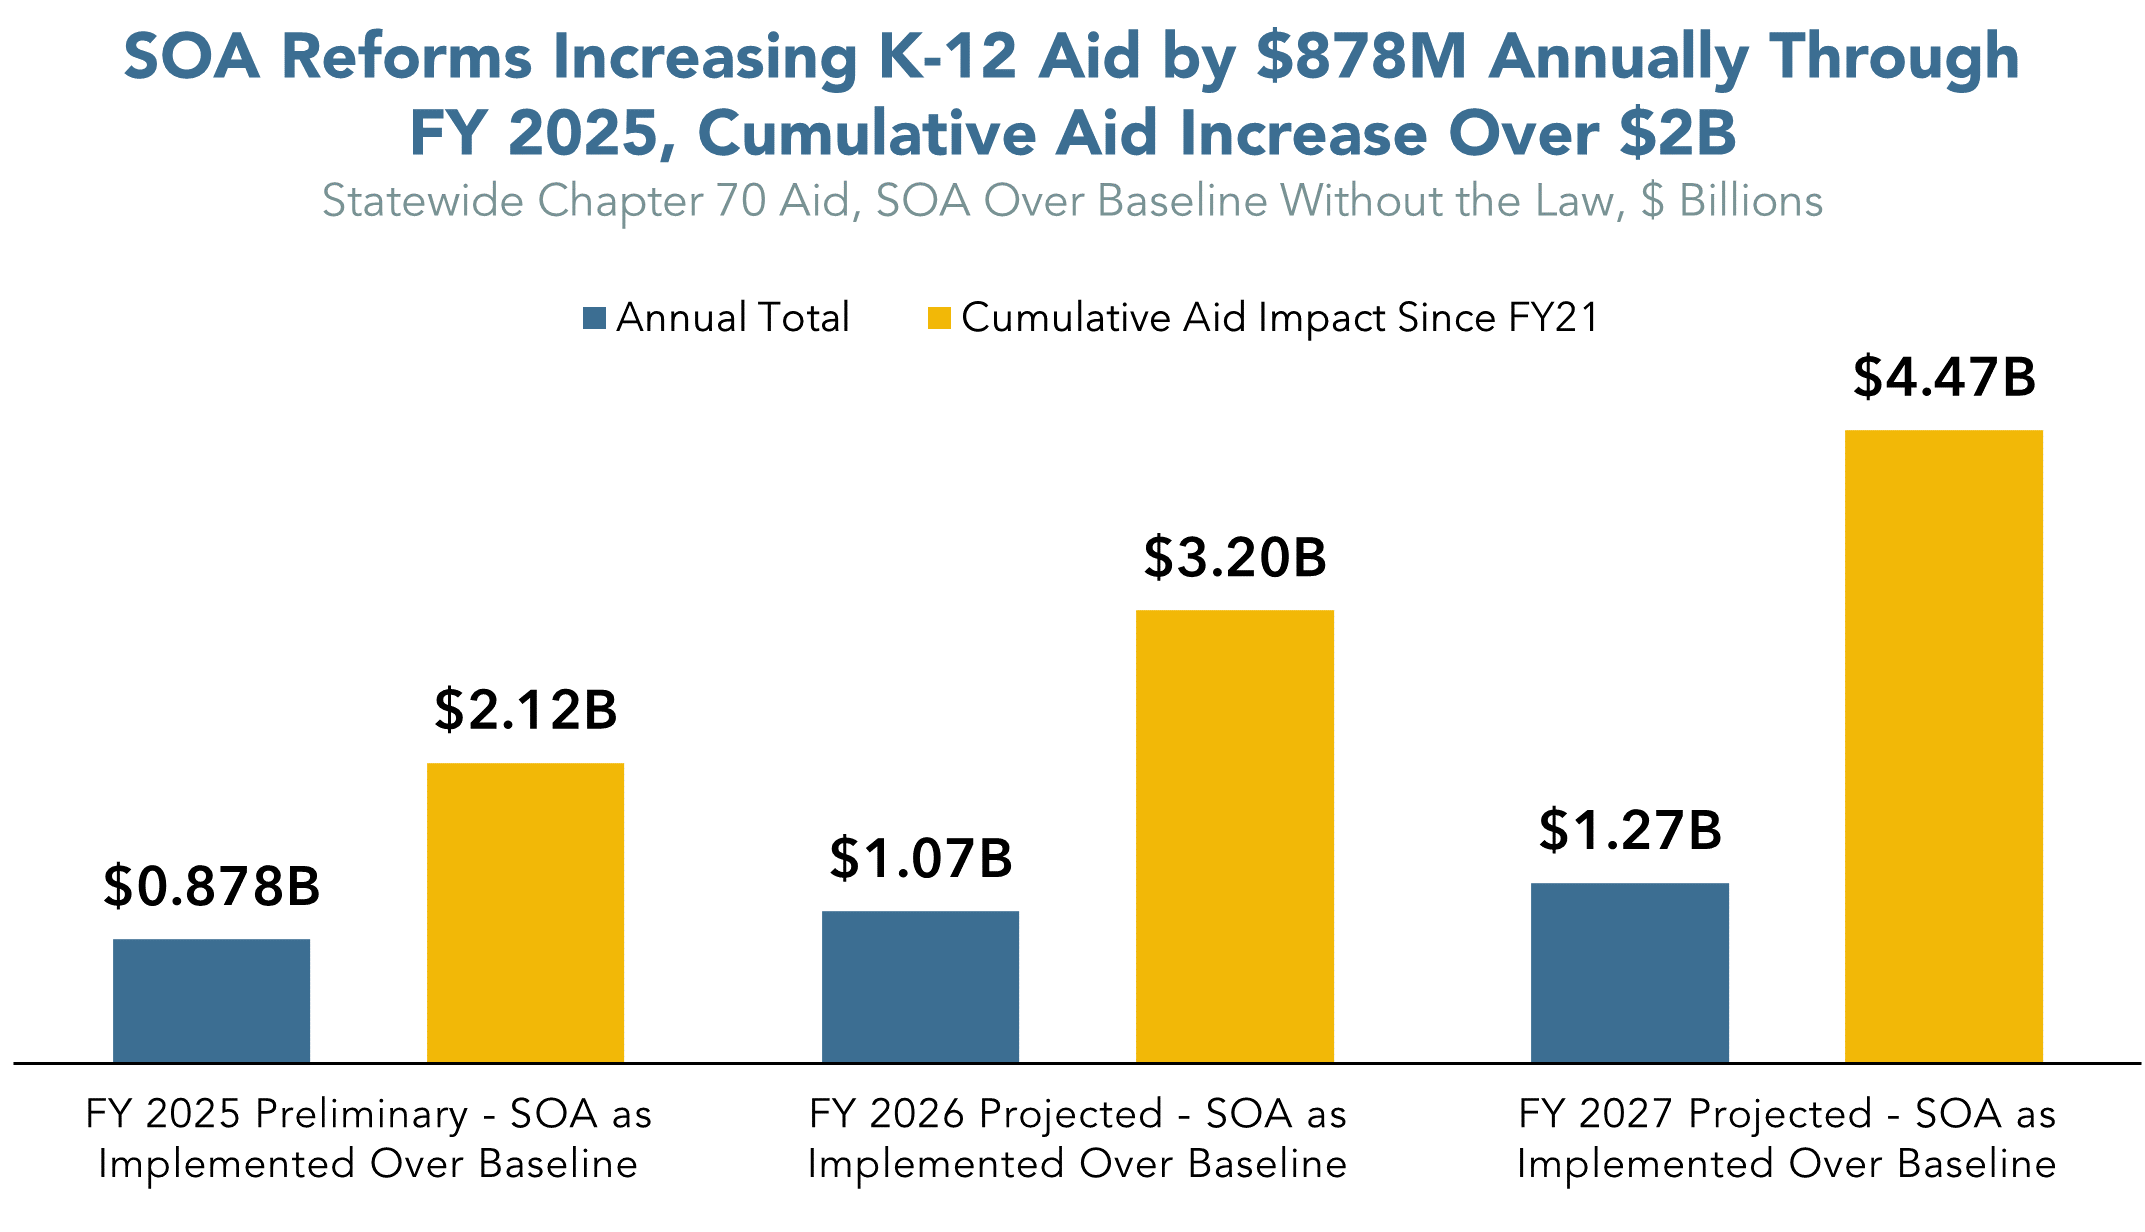
To date, the impact of the SOA on K-12 funding is profound. As of the current FY 2025 budget process, the SOA has added $878 million on an annual basis to school aid across the state. When considering the cumulative aid added from FY 2022 through FY 2025 the total is $2.12 billion (see chart below). The Gateway Cities, which serve a disproportionate share of low-income, English Language Learners, and students of color, are receiving roughly three-quarters of the additional aid from the SOA while serving about one-quarter of all students.10 This is consistent with the intent of the SOA law to reduce educational inequities between communities of disparate wealth and income.
Scenario Two – If We Fail to Adjust for High Levels of Inflation
Looking forward, the law will be adding $1.27 billion annually by FY 2027 (the year the SOA will be completed). By FY 2027, the SOA will have added a cumulative sum of $4.47 billion in additional support to school across the state since FY 2021 compared to what would have happened without the law.
Scenario Three – Fully Accounting for Inflation
The Commonwealth has the opportunity to unlock the full benefits of the SOA by correcting for the steep inflation of the past two years. Adding additional increments will help districts address rising costs and better support students. The final projections from this study follow that approach.
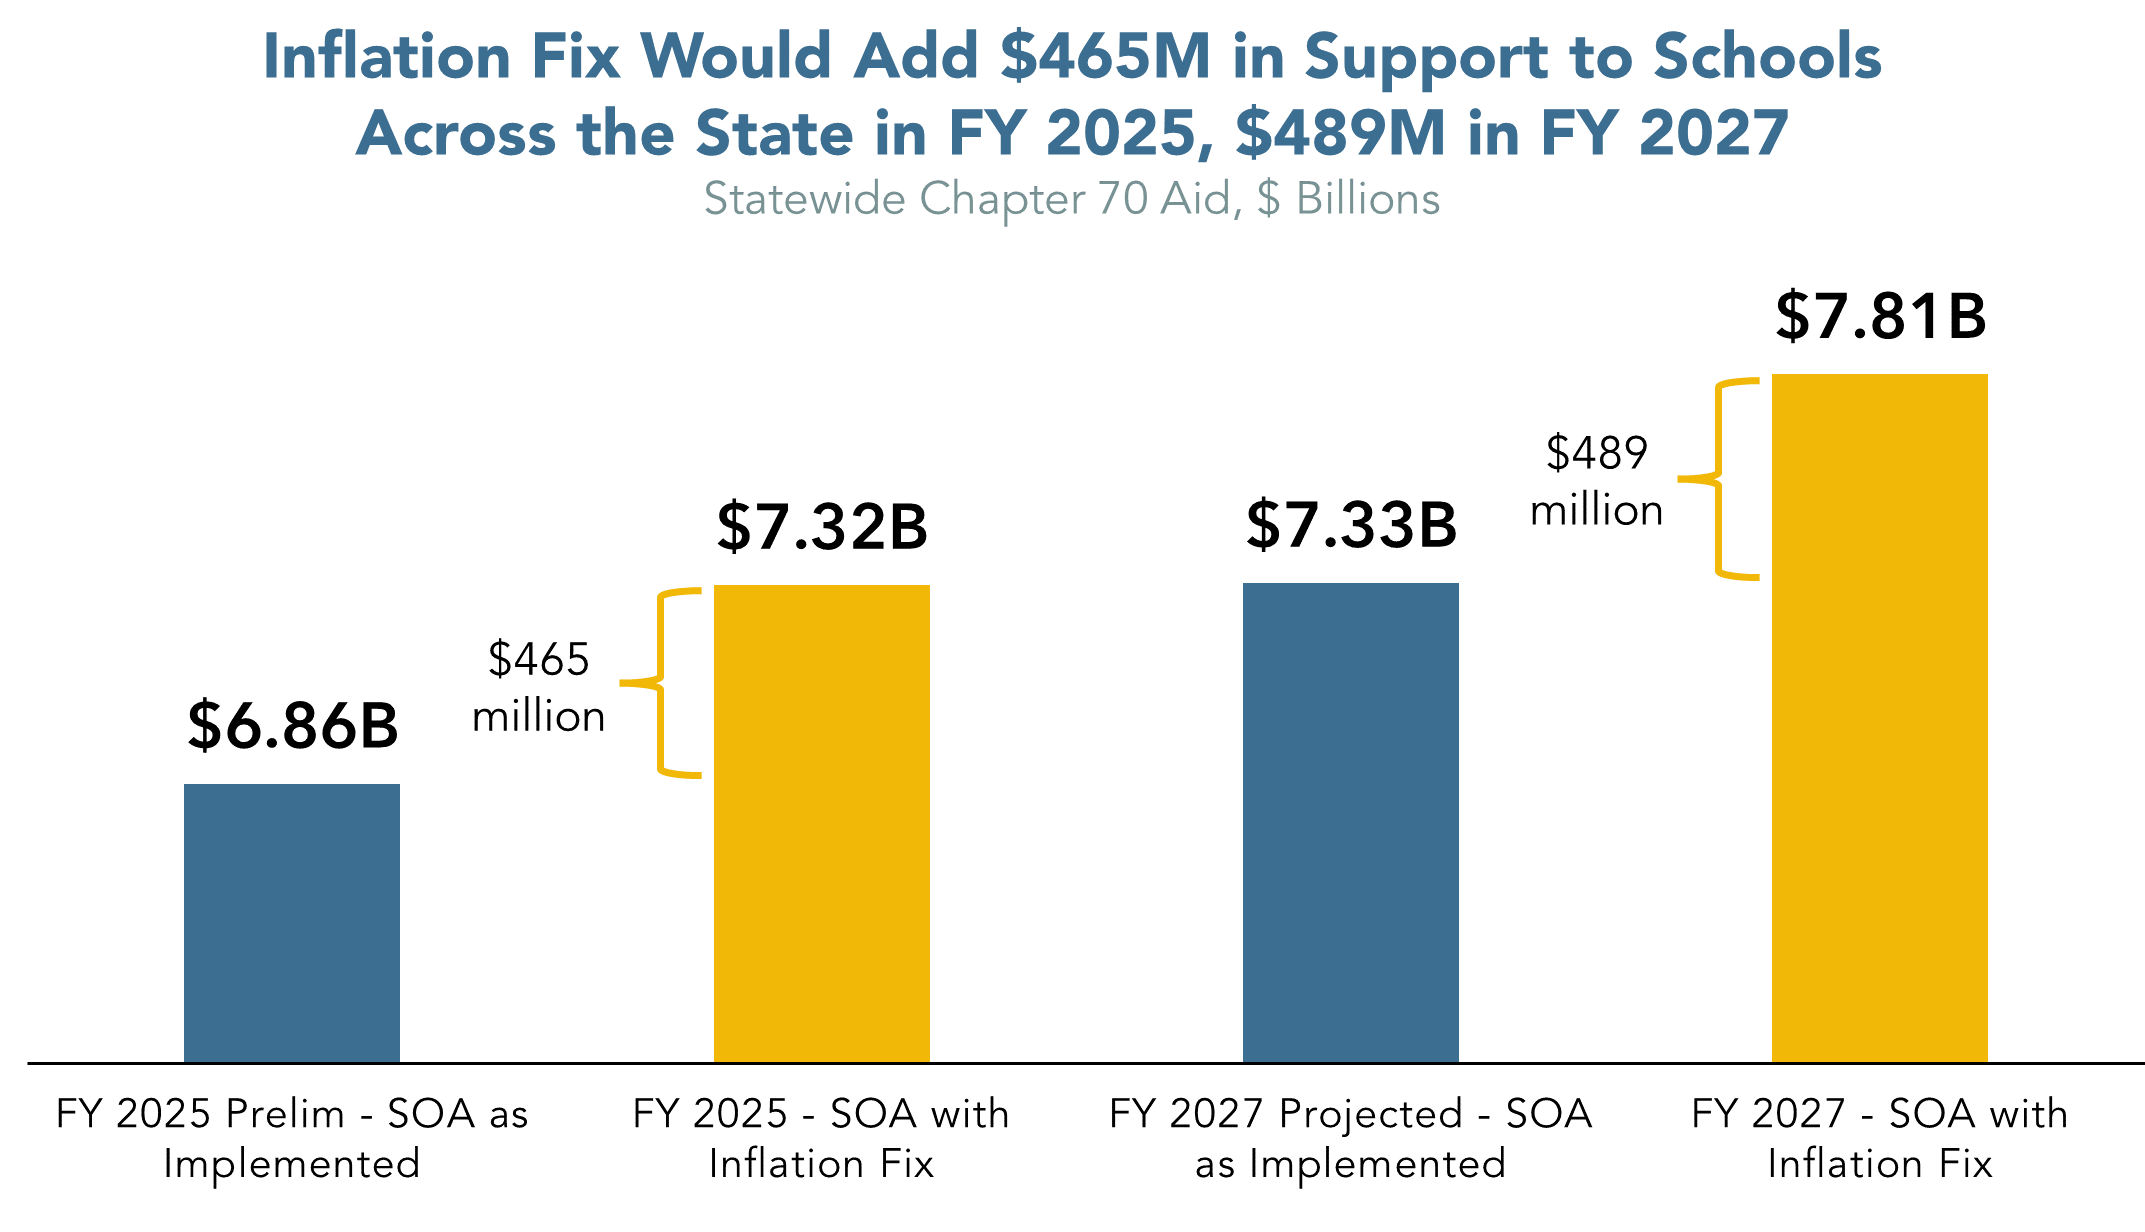
Because inflation increases cannot be retroactively added to past years’ funding, this projection considers FY 2025 funding at a level that would fully account for the missed inflation of the two previous years. This added inflation growth would be a total of roughly 6 percentage points, and would override the statutory cap of 4.5 percent. This would result in an estimated aid increase of $465 million in FY 2025 and grow slightly to $489 million annually by FY 2027 (see below). Just over half of that fix, or $248 million in FY 2025, would be directed towards Gateway Cities. While this projection is based on solving the entire issue at once, it could also be settled over multiple years, particularly before the end of the SOA phase-in in FY 2027.
For a full list of how each district is faring under the SOA and would be impacted by updating inflation to match cost growth over the past several years, click HERE.
Endnotes
1 Colin Jones and Roger Hatch. “Towards Equity: School Funding Reform in Massachusetts. MassBudget. 2019. https://www.massbudget.org/reports/pdf/Towards%20Equity%20Final.pdf
Massachusetts Department of Elementary and Secondary Education. “Student Opportunity Act” 2021. https://www.doe.mass.edu/soa/
2 The General Court (Legislature) of the Commonwealth of Massachusetts. Joint Committee on Education. “Student Opportunity Act Questions & Answers.” September, 2019.
3The General Court of the Commonwealth of Massachusetts, Joint Committee on Education. “Student Opportunity Act Factsheet.” September, 2019. pg. 2-3
4Colin Jones. “The American Rescue Plan Act and Federal Relief Funds for K-12 Schools in Massachusetts” MassBudget. 2021. pg 1.
https://massbudget.org/2021/11/10/federal-k12-funds-2021/
5 Christopher Huffaker. “Pandemic Funding for Mass. Schools Going Away, But State Funding Should Soften the Blow” Boston Globe. December 2023. https://www.bostonglobe.com/2023/12/08/metro/pandemic-school-funding-fiscal-cliff/?p1=SectionFront_Feed_AuthorQuery&p1=Article_Inline_Text_Link
6 FY 2022 Chapter 70 and Net School Spending Requirements. Massachusetts Department of Elementary and Secondary Education. May, 2021. https://www.doe.mass.edu/finance/chapter70/fy2022/chapter-2022.html
7 The General Court (Legislature) of the Commonwealth of Massachusetts. “General Laws Part I, Title XII, Chapter 70, Section 2. “Foundation Inflation Index” and “Foundation Employee Benefits Inflation Rate”
https://malegislature.gov/Laws/GeneralLaws/PartI/TitleXII/Chapter70/Section2
The SOA added one exception to the inflation index and 4.5 percent cap used throughout the formula, for the cost of educator health care. These costs are increased through a separate factor tied to health care cost growth in the Group Insurance Commission system for state employees and are uncapped.
8 FY 2023 Chapter 70 and Net School Spending Requirements. Massachusetts Department of Elementary and Secondary Education. July, 2022. https://www.doe.mass.edu/finance/chapter70/fy2023/chapter-2023.html
FY 2024 Chapter 70 and Net School Spending Requirements. Massachusetts Department of Elementary and Secondary Education. August, 2023.
https://www.doe.mass.edu/finance/chapter70/fy2024/chapter-2024.html
9 MassBudget Budget Browser. “K-12: Chapter 70 Aid.” 2024
https://massbudget.org/budget-browser/subcategory/?id=K-12%3A+Chapter+70+Aid&inflation=cpi
10 Massachusetts Department of Elementary and Secondary Education. “School and District Profiles – 2023-24 Enrollment by Grade Report – 2023-24 Selected Populations Report – 2023-24 Enrollment by Race/Gender Report.” 2024. https://profiles.doe.mass.edu/statereport/enrollmentbygrade.aspx
https://profiles.doe.mass.edu/statereport/selectedpopulations.aspx
https://profiles.doe.mass.edu/statereport/enrollmentbyracegender.aspx
MassINC. “About the Gateway Cities.” 2024.
https://massinc.org/our-work/policy-center/gateway-cities/about-the-gateway-cities/


