Businesses in Massachusetts depend for their success and profitability on a wide array of investments made by our state and local governments. These include investments in transportation infrastructure, a healthy and well-educated workforce, affordable housing for employees and customers, public safety, and a legal system that enforces contracts and settles business disputes – to name just a few. Businesses help support these public functions through a variety of different taxes, including property, sales, and corporate income taxes. While state and local business taxes amount to only a small portion of overall business costs for most U.S. businesses – on average, roughly 2 percent of total costs – business taxes nevertheless are an important source of revenue for communities and for the Commonwealth.1
In Massachusetts, the revenue businesses contribute through their corporate excise and related tax payments has dropped markedly as a share of total state tax collections over the past four decades (see chart below).2 Corporate excise collections come primarily from taxes on corporate profits, though how such taxes are levied and calculated varies depending on the industry the corporation operates within.3
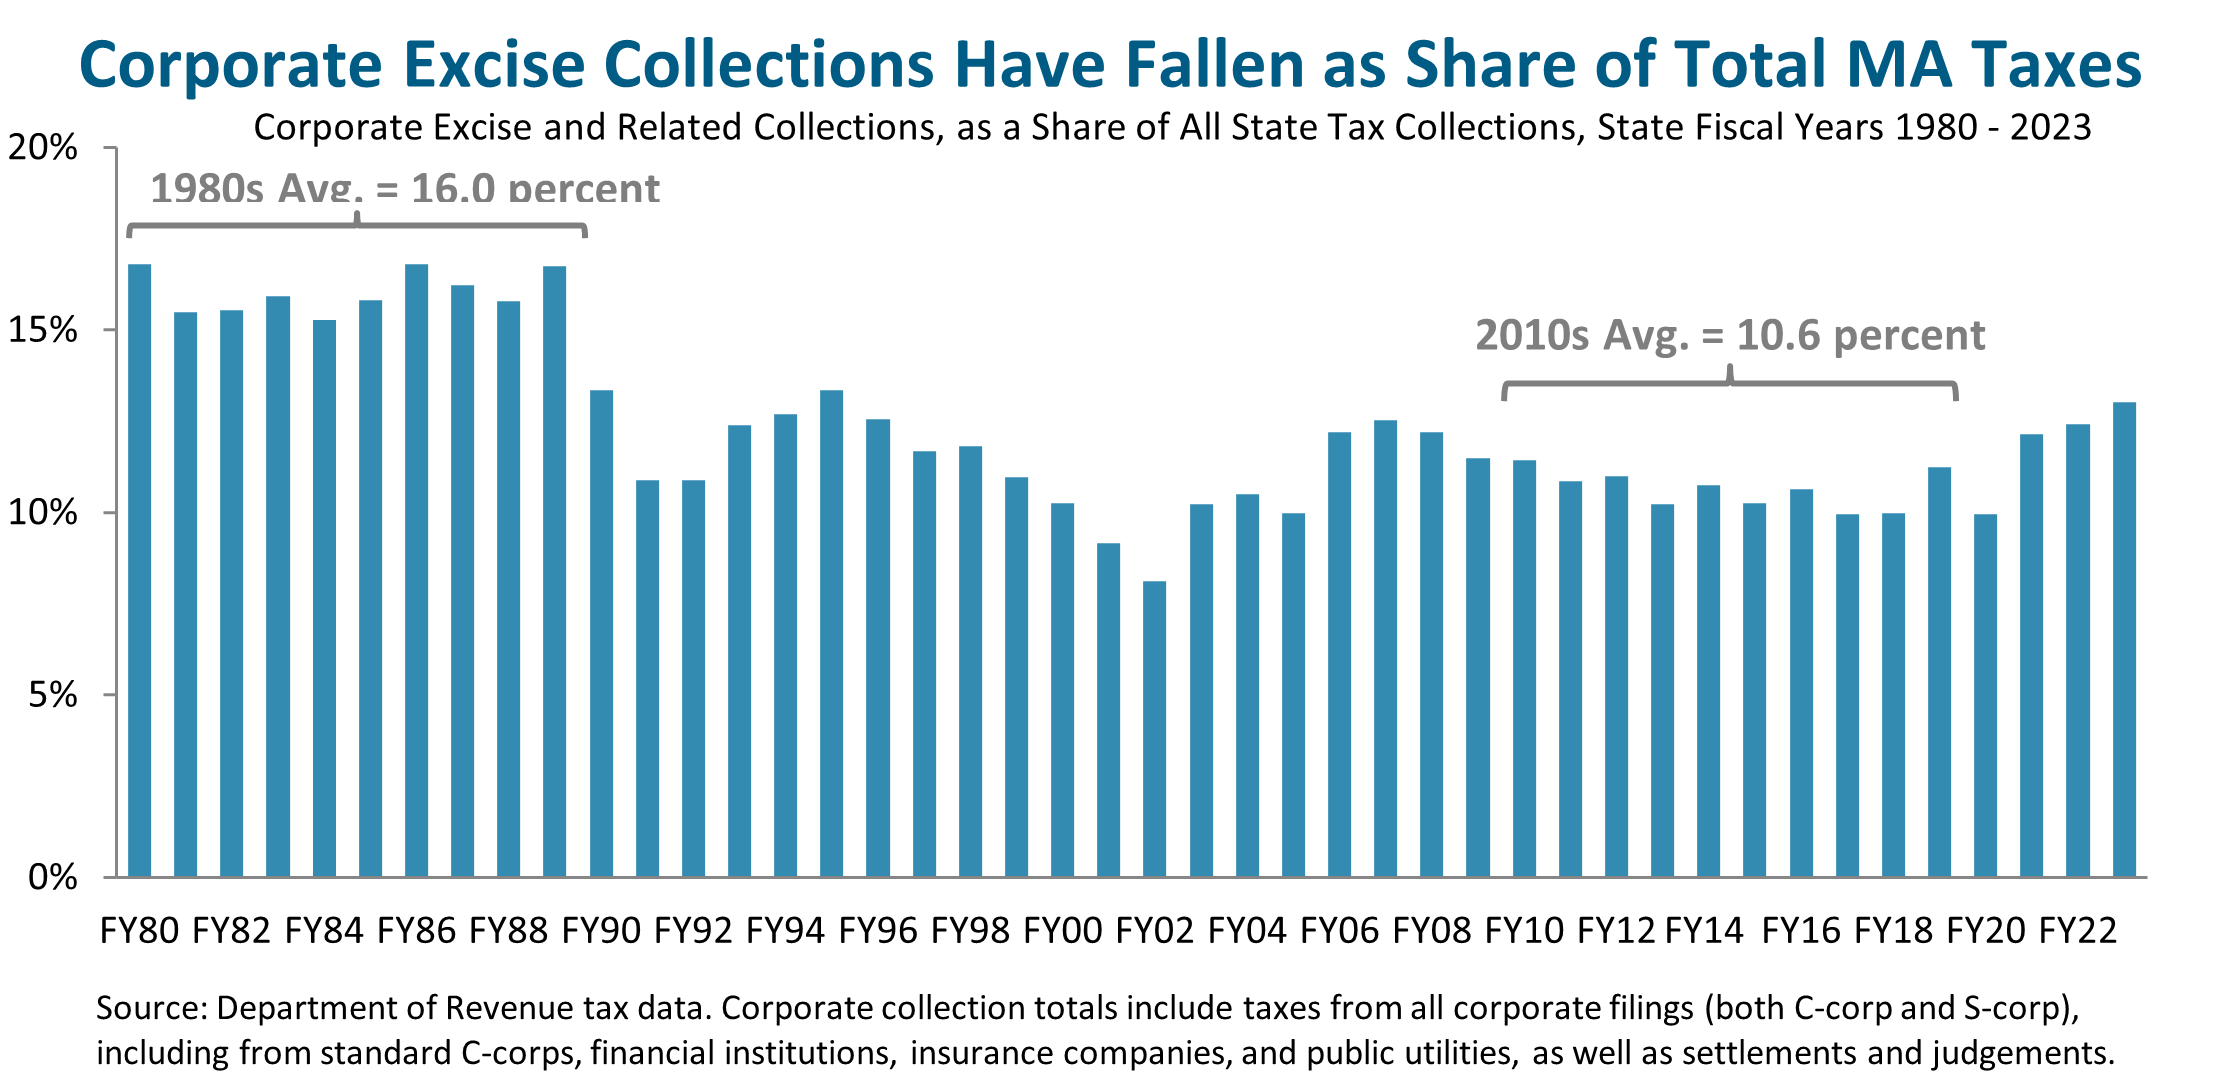
Throughout the 1980s (the earliest years for which fully comparable Department of Revenue data are readily available), collections from corporate excise and related tax payments provided about 15 to 17 percent of the Commonwealth’s total tax collections (see chart, above). During the 2010s, that figure hovered in the 10 to 11 percent range, a drop of about a third since the 1980s. This drop in share is all the more surprising given that Massachusetts implemented significant cuts to the personal income tax in the 2000s and 2010s. (Holding other aspects of state tax policy constant, cutting state personal income taxes would increase the share of state tax revenue generated by the corporate excise tax. Instead, as noted, the share dropped significantly.) The share has risen modestly during the first four years of the 2020s (Fiscal Years 2020 – 2023), averaging 11.9 percent. The COVID pandemic had a large impact on the economy during these years, with many large corporations posting record profits, even as personal income for many households fell. This mismatch explains at least some of the recent rise in the share of total state taxes derived from corporate excise and related taxes.
Had Massachusetts collected an amount of corporate excise and related taxes equal to the share of the total collected throughout the 1980s (on average, around 16 percent of all taxes), businesses would have contributed another $1.2 billion in these taxes to the Commonwealth in Fiscal Year 2023.4 Instead, individual taxpayers – including those with low and moderate incomes – had to pick up a sizeable portion of this cost and/or the Commonwealth – and by consequence, the people of Massachusetts – were deprived of the benefit of these revenues.
Counterintuitively, this downward trend in corporate excise taxes as a share of our state total has occurred even as U.S. corporate profits have risen markedly as a share of national income (see chart, below). Where corporations collected about 8 to 10 percent of all U.S. income during the 1980s, in the aftermath of the 2008 Great Recession corporations have been collecting about 13 to 14 of national income, a large increase.
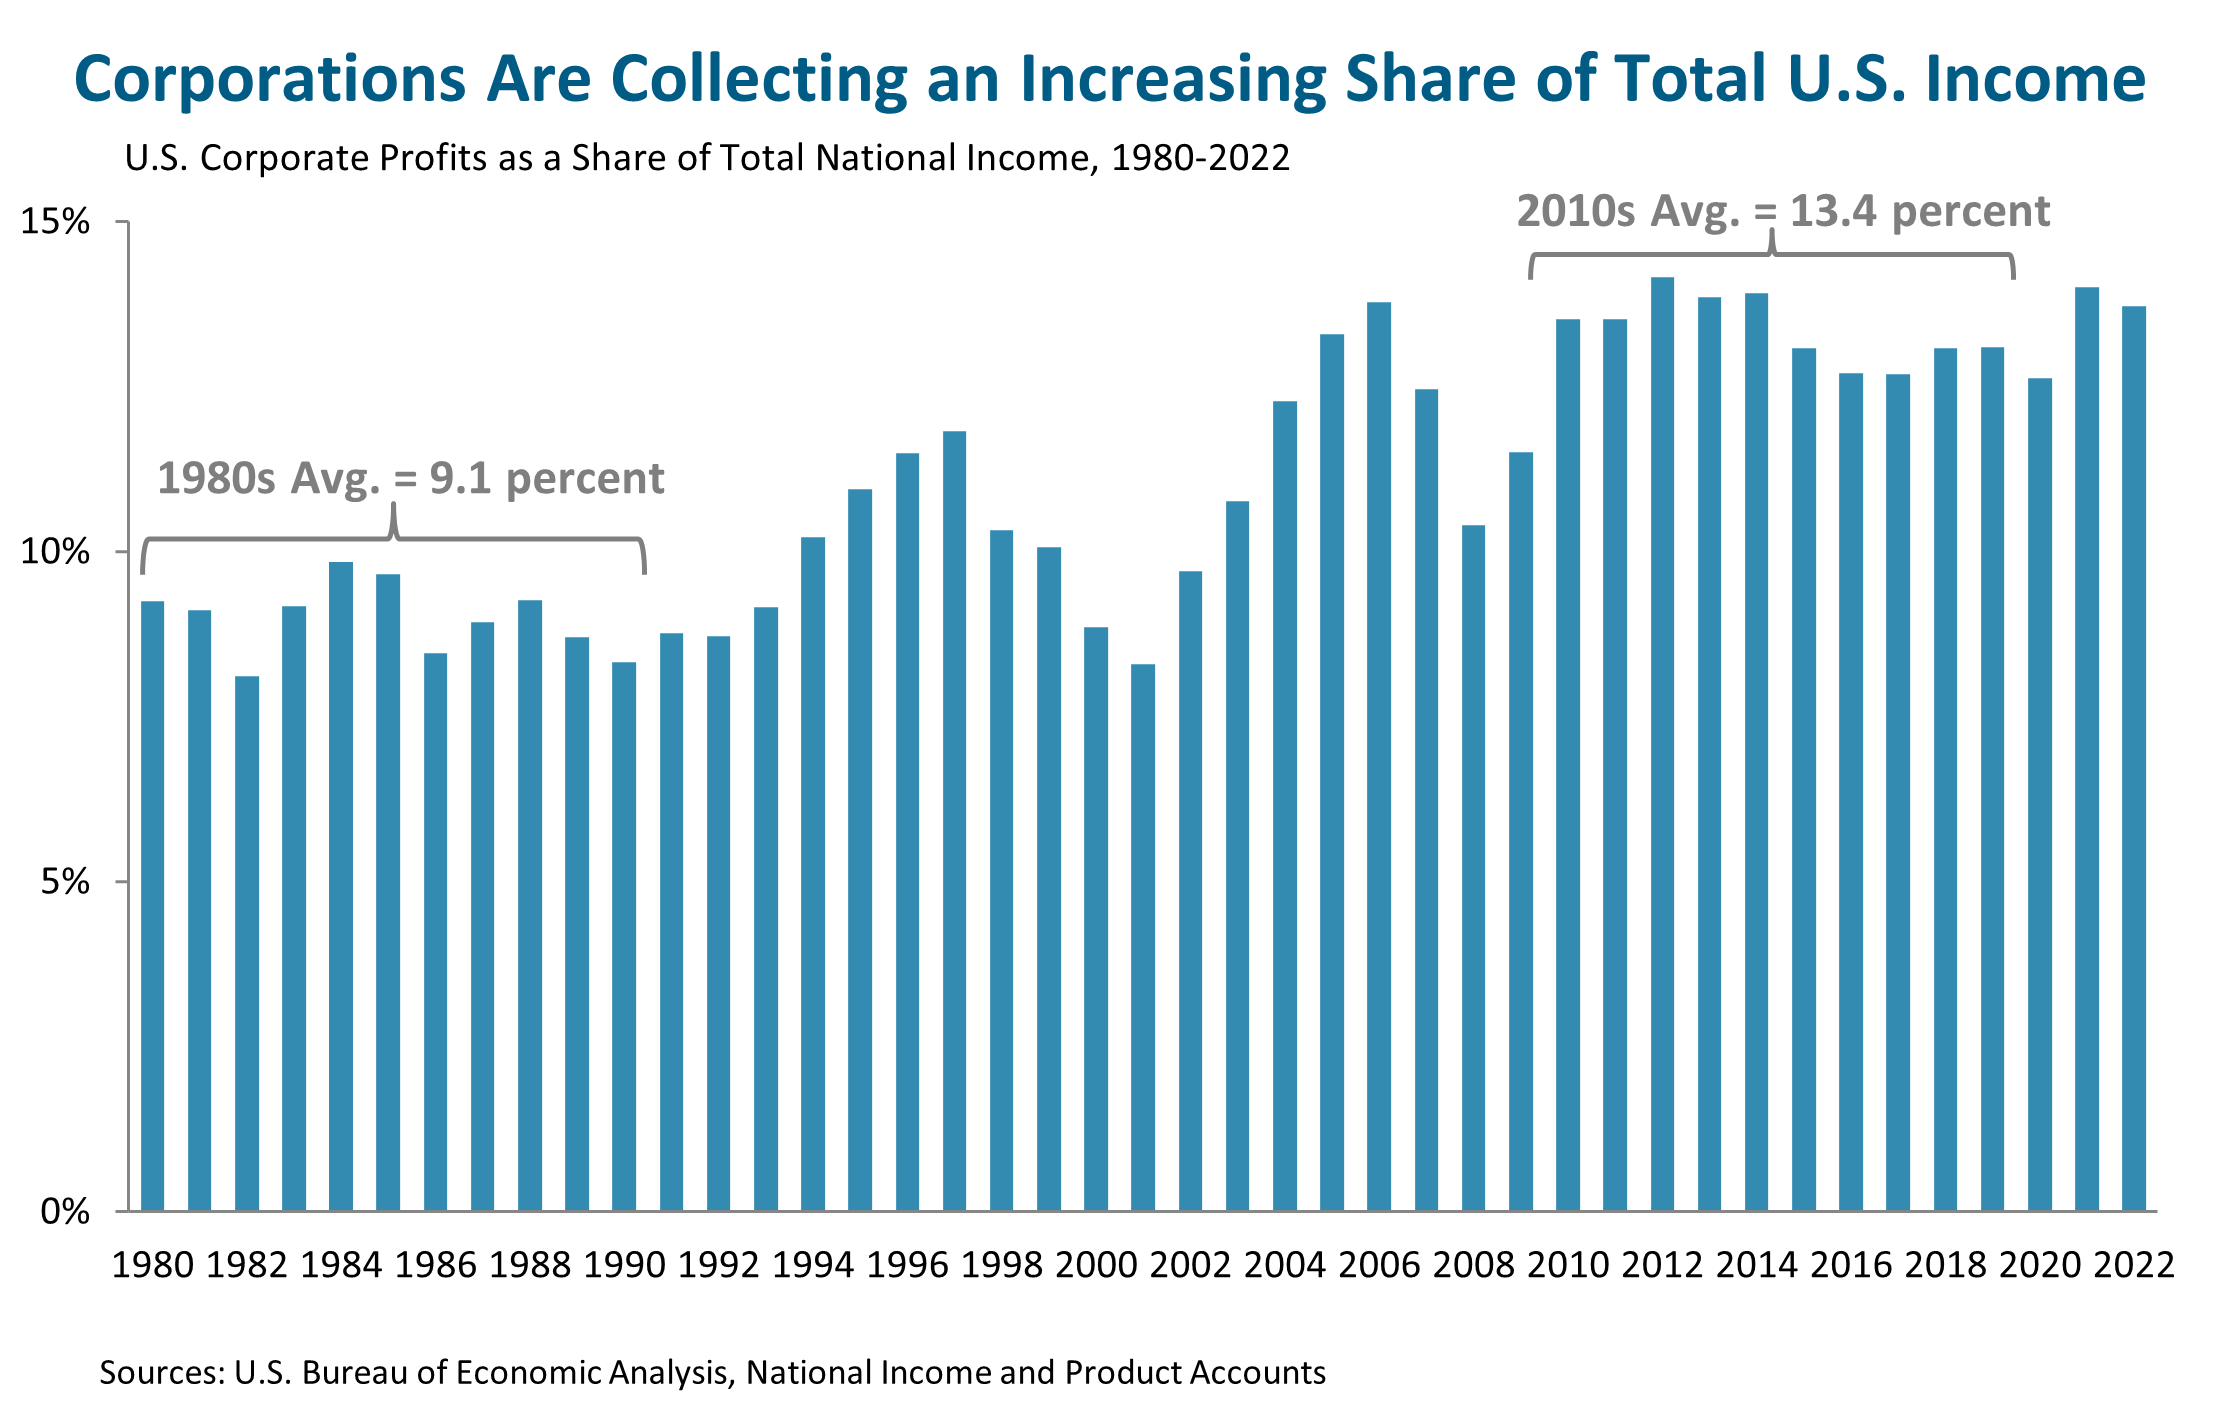
With corporations claiming a growing slice of the national income pie, this means that a declining share of national income is flowing to workers through their wages and salaries. Over the course of a generation, this shift has helped push household income and wealth inequality to levels not seen in the U.S. since the 1920s, delivering remarkable gains to the highest income households. Meanwhile, many moderate-income households have seen only very modest gains during the last several decades – and many low-income households have seen little gain at all.5
Taken together, the data in these two charts highlight a growing mismatch: Corporations are capturing a substantially larger share of all U.S. income, but the taxes they are paying to the Commonwealth on these profits represent a declining share of the total taxes collected by the Commonwealth. Over the long term, this will deprive the Commonwealth of revenue needed to support the many public goods that allow businesses and people in Massachusetts to thrive – or will shift much of those costs onto other, non-corporate taxpayers, including low- and moderate-income households.
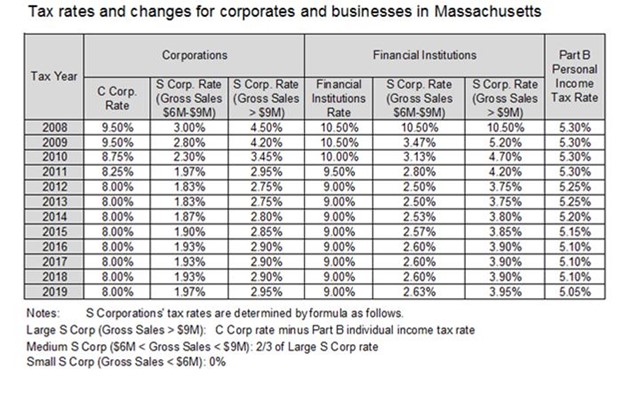
There is no single reason for this growing mismatch. Changes in the global and national economy, labor laws governing unionization, consumer spending patterns, federal tax policy, the effects of the business cycle – all of these factors and many more have played a role. While the full picture is complex, it nevertheless is clear that several factors close to home have contributed directly to the problem. In 2008, Massachusetts lawmakers approved a phased reduction in the tax rates paid by corporations on their profits, dropping rates from 9.5 percent to 8.0 percent on most corporate profits (see Appendix A). Massachusetts lawmakers likewise created new and expensive corporate tax breaks during the last 25 years, now costing the Commonwealth hundreds of millions annually in lost revenue.6 And large, multi-state and multinational corporations have become increasingly aggressive in pursuing tax avoidance strategies that deprive the federal and state governments of revenue.7 For each of these three sources of corporate tax revenue loss – state rate cuts, state tax breaks, and growing tax avoidance – there exist state-level policy options that can reduce tax losses and help reconnect rising corporate profits to the amount of state taxes corporations pay.
Policy Options Can Address Corporate Tax Share Decline
Raising Corporate Tax Rates
Raising tax rates on corporate income would be one way to slow – or possibly even reverse – the downward trend in corporate excise and related tax collections as a share of state taxes. It would help rebalance the state’s tax system, reducing the share of total state taxes paid by families and individuals. A higher corporate income tax rate also could generate substantial additional revenue to invest in K-12 and higher education, infrastructure, affordable housing and early childhood education, as well as other areas that would expand opportunities and strengthen the Massachusetts economy.
The current tax rate in Massachusetts on most corporate profits is 8.0 percent.8 As recently as 2009, however, that rate stood at 9.5 percent (see Appendix A). Restoring corporate rates to their 2009 levels represents one possible approach to rebalancing the tax system. Very broadly speaking, a return to 2009 rates likely would generate roughly $600 – $700 million of additional tax revenue annually.9 This additional revenue would provide about half of the $1.2 billion in missing annual corporate tax revenue discussed above. At a minimum, about half of this additional revenue would come from large corporations – those with over $500 million in annual receipts – though it is likely the actual share coming from these large corporations would be much higher.10
Reducing the Cost of Special Business Tax Breaks
Reducing the cost of special business tax breaks is another way the Commonwealth could slow the decline in corporate excise and related taxes as a share of total state collections. Research has shown repeatedly that corporate tax breaks rarely drive major investment or location decisions – and often reward businesses for decisions they would have made even without these incentives.11 Nevertheless, business groups have been successful in lobbying for a wide range of generous tax breaks.
In Massachusetts, businesses are eligible for dozens of different tax breaks. While a number of these are available to all types of businesses, a subset is available only to businesses operating in certain industries or engaging in particular activities. In 2017, these special business tax breaks cost the Commonwealth over $1 billion annually. They have grown significantly in number and cost over the last 20 to 25 years.12 Three of these special business tax breaks alone – the single sales factor tax break for manufacturers, the single sales factor tax break for mutual fund companies, and the film tax credit – together cost the Commonwealth over $300 million a year.13 Despite this major investment of state resources, the manufacturing and mutual fund industries together have shed tens of thousands of jobs since successfully lobbying for their respective tax breaks.14 Analysis by the Department of Revenue meanwhile repeatedly finds the film tax credit to be a remarkably costly and inefficient mechanism for job creation.15 Scaling back or eliminating these and many other inefficient business tax breaks would help push back against the trend of falling corporate excise taxes as a share of total state tax collections. Unfortunately, in the 2023 tax package, lawmakers instead added to the challenge by extending the single sales factor tax break to all businesses, a change that will cost the Commonwealth an additional estimated $85 million a year in lost corporate tax revenue.
Reforming Corporate Tax Disclosure Requirements
Curtailing or eliminating ineffective or inefficient tax breaks requires that lawmakers and the public have a clear understanding of which companies are using each tax break and to what degree, and how this affects their overall tax payments. An essential tool therefore is robust corporate tax disclosure requirements.16 To achieve their intended purpose – allowing meaningful review of existing state corporate tax breaks – these disclosure requirements need to be company-specific and provide several specific pieces of information. These include a corporation’s gross receipts and income, apportioned income and taxable income, the amount of excise tax due and paid, and the amount of each tax credit a corporation claims in order to reduce its excise tax. Additionally, this information must be readily available to the public in an easily searchable, online database. With this information, legislators and the public are in a far better position to understand which corporations are reducing their state tax liabilities, how they are using tax breaks to do so, and whether each tax break is having its intended effect in terms of job creation, increased capital investment, etc. Lawmakers and the public then can make informed decisions about if and how the Massachusetts’s tax code should be amended to reduce or eliminate ineffective, inefficient, or unusually costly corporate tax breaks.
While Massachusetts has a corporate tax disclosure law (initially passed through a citizens’ ballot initiative in 1992), it was amended later by the Legislature to make the reports anonymous rather than company-specific, thus eliminating much of the value the data otherwise might bring to tax discussions.17 Likewise, though the law requires corporations to file tax disclosure reports annually with the Secretary of State, it is unclear whether corporations comply with the law. The information from these reports has not been made readily available to the public through a searchable online database or other similar means.
Combatting Aggressive Corporate Tax Avoidance
The increasingly aggressive efforts of corporations to avoid federal and state taxes is a serious problem recognized widely by tax authorities and other tax experts.18 When multinational corporations with sophisticated accounting departments engage in aggressive tax avoidance schemes, it robs the federal and state governments of revenue they should be receiving and leaves smaller and local businesses at a competitive disadvantage. By reducing the benefit that multinational corporations derive from these accounting maneuvers, Massachusetts would help level the playing field for smaller Massachusetts businesses and be better able to collect the taxes due to the Commonwealth.
There are two tax policies that Massachusetts lawmakers could adopt which would reduce the tax advantages multinational corporations gain from aggressive tax avoidance schemes. The additional revenue collected through each of these policy changes would come from multinationals that are profiting from their operations in Massachusetts but are avoiding their full tax obligations by shifting some of their U.S. generated profits to offshore tax havens.
First, Massachusetts could adopt the federal approach to taxing Global Intangible Low-Taxed Income or “GILTI”. The federal GILTI provision is an attempt to tax a portion of multinationals’ shifted profits. Unfortunately, the federal and state governments in the U.S. operate under a “water’s edge” tax system, meaning tax authorities do not have access to detailed information about the finances of corporations’ overseas subsidiaries. Tax authorities thus are not able to determine with precision how much of a corporation’s profits are generated through its U.S. operations vs. its offshore operations. This in turn leaves tax authorities at a severe disadvantage in assessing how much of a corporation’s profits should be taxed by U.S. federal and state governments.
Recognizing the serious problem of tax revenue loss resulting from aggressive corporate profit shifting, the federal government created a system for estimating the amount of profits shifted to offshore tax havens and then taxing 50 percent of these GILTI profits. Unlike many other states which follow the federal approach – including several New England states – the Commonwealth currently taxes only 5 percent of the GILTI profits apportioned to Massachusetts. Adopting the federal approach of taxing 50 percent would deliver hundreds of millions of dollars annually to the Commonwealth.
Second, Massachusetts could adopt “worldwide combined reporting” (WWCR), also known as “complete reporting.” Like the federal GILTI provision, WWCR addresses the inability of tax authorities, under the current “water’s edge” system, to ascertain where corporate profits are generated – and thus to know how much tax a corporation owes. Under the water’s edge approach, corporations calculate the amount of their profits taxable in each state by looking only at their total U.S. profits. By contrast, under WWCR, multinational corporations calculate the amount of their profit taxable in each state as a share of the total profits they generate from their entire, worldwide operations. Requiring corporations to use WWCR eliminates many tax avoidance opportunities that are available under the water’s edge system.19 The Institute on Taxation and Economic Policy has estimated that adoption of WWCR could deliver over $600 million annually to the Commonwealth.20
Corporate Taxes and Overall Tax Fairness
Slowing or reversing the downward trend in corporate excise and related taxes as a share of total state tax collections would help turn our state’s upside down tax system right side up, making the overall tax system in Massachusetts less regressive. (A “regressive” tax system is one in which those with lower incomes pay a larger share of their income in taxes than those with higher incomes do.) This is because a sizable share of the final cost (or “incidence”) of taxes paid by corporations falls on corporate shareholders.21 Ownership of corporations is overwhelmingly concentrated among those households with the highest incomes.22 Federal Reserve Board data for 2022 show that households in the top 10 percent of incomes had median stock holdings of $601,000, while households in the middle 20 percent of incomes had median stock holdings of just $23,500.23
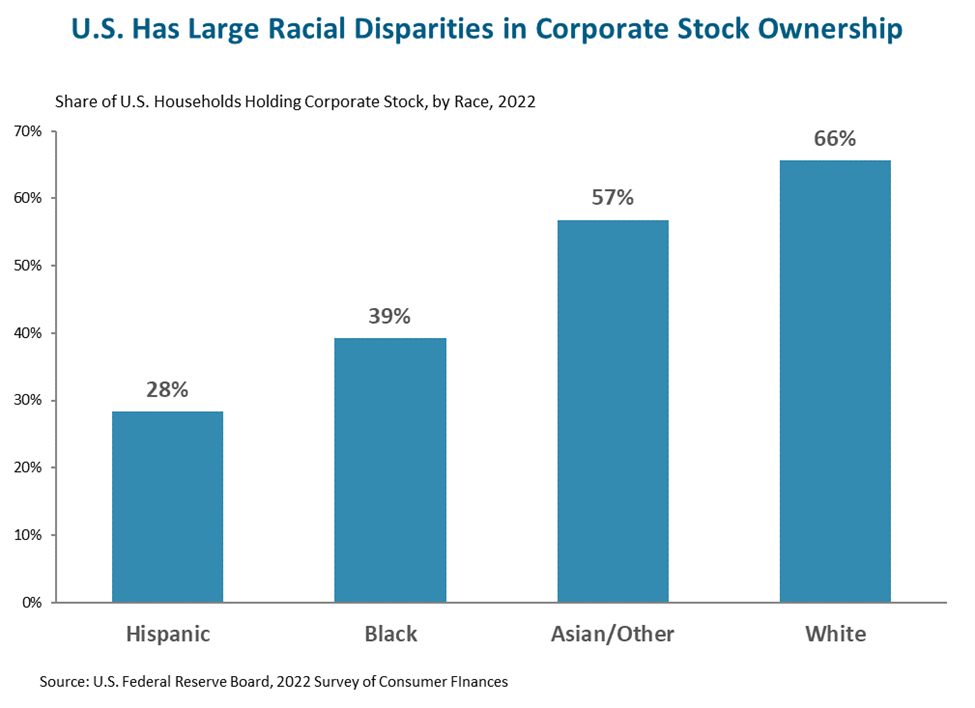
The concentration of corporate ownership also means that the declining share of corporate taxes in the Commonwealth’s overall revenue stream worsens racial inequality in Massachusetts. A long history of systemic barriers to opportunity has prevented many people of color in Massachusetts from equitable access to high-paying jobs, education, and other avenues leading to higher household income and wealth, including the acquisition of corporate stocks and bonds. As a result, corporate shareholding is disproportionately white, and thus an increase in the corporate income tax would have the additional effect of reducing tax inequities by race. Federal Reserve Board data for the U.S. show that in 2022 over 65 percent of white households owned some amount of corporate stock (including corporate stock owned directly or in the form of mutual fund holdings).24 This figure drops to 57 percent for Asian/Other households, to 39 percent for Black households, and to 28 percent for Hispanic households. Moreover, the median value of corporate stock held by white households who own such assets is $68,000. For Asian/Other households that median is $34,000. For Hispanic households it is $24,500 and for Black households $16,500.25
Can Massachusetts Corporations Afford a State Tax Increase?
How would an increase in corporate income tax collections affect Massachusetts’ business taxes relative to other states? When all state and local business taxes are taken into account, multiple studies show that business tax levels in Massachusetts are below the U.S. average. In terms of the share of total state and local taxes paid by businesses, Massachusetts is among the lowest of all states.26 The results of these analyses suggest that the Commonwealth is in a good position to raise additional revenue from businesses.
Recent federal corporate tax cuts likewise strongly suggest that businesses – particularly, large, profitable C-corps operating in Massachusetts and elsewhere – are well-able to absorb higher state and local tax costs. The 2017 “Tax Cuts and Jobs Act” (TCJA) cut federal tax rates dramatically on C-corp income, from 35 percent down to 21 percent. Additionally, the TCJA greatly reduced the taxes owed by U.S.-based multinational corporations on the profits they generate through their overseas operations.27 Permanent corporate tax changes in the TCJA are estimated to deliver a tax cut for C-corps of some $85 billion per year, nationwide.28 This annual federal tax cut is more than half the total amount paid annually by businesses nationwide in state and local corporate income taxes.29
Roughly $2.4 billion of this $85 billon nationwide annual tax cut will go to businesses due to their operations in Massachusetts (based on the share of US economic activity occurring in Massachusetts – about 2.8 percent of US GDP in 2022).30 While a federal tax cut does not reduce the state and local tax obligations of businesses operating in Massachusetts, $2.4 billion equals close to half of the total amount of excise and related taxes paid annually by corporations to the Commonwealth.31 In other words, the annual federal tax cuts many corporations now enjoy (due to the TCJA) are very large and make any increase in Massachusetts state taxes considerably easier for businesses to absorb.
Endnotes
1 Using data from the most recent IRS Statistics of Income for corporations (2019), Table 2.1, nationwide, taxes and license fees together account for 1.9 percent of total business expenses. This matches the U.S. average during the years 2003-2016. See Iowa Policy Project, Peter Fisher, Grading the States (see second paragraph, accompanying pie chart, and endnote #2): http://www.gradingstates.org/the-problem-with-tax-cutting-as-economic-policy/state-and-local-business-taxes-are-not-significant-determinants-of-growth/. See also testimony to the New Hampshire Legislature from Robert Tannenwald, former Director of Research for the New England Public Policy Center, a research policy division within the Federal Reserve Bank of Boston, 11-4-2010: http://www.cbpp.org/cms/index.cfm?fa=view&id=3314
For additional detail on the IRS SOI and why it is the best source for data with which to calculate state and local business taxes as a share of total business expenses, see Center on Budget and Policy Priorities report, April 3, 2008, endnote 6 (pg. 8): https://www.cbpp.org/research/almost-all-large-iowa-manufacturers-are-already-subject-to-combined-reporting-in-other
2 Total business excise and related taxes here include income and non-income excise taxes collected from regular C-corps, as well as income excise collections from S-corps. The business total likewise includes similar excise and excise-like taxes on financial, insurance and public utilities companies; collections arising from corporate tax settlements and judgements; and from additional, corrective corporate payments. The business tax total here does not include licensing and other fees paid by businesses or sales taxes collected on purchases made by businesses.
3 The amount of corporate excise tax that most C-corps in Massachusetts owe is calculated by combining two separate measures. The first component is a tax on the company’s net income (profit) and the second is a tax on the value of the company’s tangible property or net worth. See DOR Corporate Tax Guide: https://www.mass.gov/guides/corporate-excise-tax#-calculating-the-corporate-excise-tax-
Banking and financial institutions, as well as insurance companies pay a different set of income or related excise taxes. Similarly, S-corporations do not pay the C-corp income tax, though S-corps with receipts exceeding $6 million per year are subject to a separate state income tax. For more detail on S-corp taxes see MassBudget’s factsheet: https://massbudget.org/reports/pdf/S-corps%202017%20explainer.pdf
4 Total state budgetary tax collections in FY 2023 = $39.208 billion. Total corporate excise and related collections = $5.108 billion. Calculation of reduction in the amount of FY 2023 tax that businesses paid relative to 1980s average (16 percent) of total state tax collections:
$39.208 billion * 0.16 = $6.273 billion
$6.273 billion – $5.108 billion = $1.165 billion
5 See Center on Budget and Policy Priorities, “A Guide to Statistics on Historical Trends in Income Inequality,” (Figure 1 and Figure 3): https://www.cbpp.org/research/a-guide-to-statistics-on-historical-trends-in-income-inequality
6 State lawmakers’ appetite for providing large, profitable corporations with tax breaks continues. In addition to a raft of earlier special business tax breaks, in 2018, Massachusetts lawmakers rejected the federal government’s approach to taxing Global Intangible Low-Taxed Income (GILTI). Instead, they adopted an approach that collects only a tenth as much revenue as use of the federal approach would. This tax break alone costs the Commonwealth over $400 million annually. Similarly, in the 2023 tax package, lawmakers acceded to business demands for a shift to single sales factor apportionment. The Department of Revenue estimates this change in how corporate taxes are calculated will cost the Commonwealth $85 million annually. This revenue loss is not reflected yet in the amount of corporate income tax received by the Commonwealth.
7 Jane G. Gravelle, Policy Options to Address Corporate Profit Shifting: Carrots or Sticks? April 2016, pgs. 1-2 http://www.law.nyu.edu/sites/default/files/upload_documents/Jane%20Gravelle.pdf
Other examples of reports highlighting the growth of corporate tax avoidance include the following:
The Institute on Taxation and Economic Policy report, “Corporate Tax Avoidance Remains Rampant Under New Tax Law”, July 2021: https://itep.org/corporate-tax-avoidance-under-the-tax-cuts-and-jobs-act/ and
Center on Budget and Policy Priorities, “Growing Tax Avoidance by Multinationals Undermines Competition, OECD Warns” February 2013: https://www.cbpp.org/blog/growing-tax-avoidance-by-multinationals-undermines-competition-oecd-warns
8 DOR Corporate Tax Guide: https://www.mass.gov/guides/corporate-excise-tax#-calculating-the-corporate-excise-tax-
Financial institutions are taxed at a slightly higher rate. Insurance companies are taxed based on the value of the policies they issue, rather than directly on their profits. Corporations eligible for and electing S-corp status do not pay the C-corp income tax, though S-corps with receipts exceeding $6 million per year are subject to a separate state tax on their profits.
9 A lack of sufficiently detailed, current, publicly available data on corporate excise collections makes it difficult to produce precise estimates of the likely gain in revenue from such a rate increase. The range presented in this estimate ($600 – $700 million) is defined according to revenue collections observed during the last two fiscal years. In FY 2022, corporate excise and related tax collections totaled $5.420 billion (adjusted to 2023 dollars). In FY 2023, corporate excise and related collections totaled $5.108 billion. The large majority of these totals was collected from excise taxes on corporate profits (as opposed to taxes applied to tangible property or net worth, the other measure used in determining a corporation’s total state excise tax liability). Restoring corporate tax rates to their 2009 levels would affect only the income measure of the excise tax. Analysis of DOR’s Corporate Excise Tax Reports, from 1993 – 2015, shows that the income measure of the corporate excise tax tends to account for about 70-80 percent of total corporate excise collections. A rough estimate (using the more conservative 70 percent assumption) of the impact of a 1.5 percentage point increase in corporate income tax rates can be calculated as follows:
1.5 percentage point/8.0 percentage point base = 18.75 percent increase
$5.430 billion x 0.70 x 0.1875 = $712.7 million increase in excise collection in FY 2022
$5.108 x 0.70 x 0.1875 = $670.4 million increase in excise collections FY 2023
These estimates assume that entity-level excise rates applied to S-corps are increased by the same 18.75 percent increase applied to the standard C-corp rate and the financial corporation rate.
10 Drawing on DOR’s most recent annual Corporate Excise Report (2019) as an example, 47 percent of income excise tax was directly attributable in that year to corporations with over $500 million in annual receipts. Fifty-three percent of income excise tax was directly attributable to corporations with over $100 million in annual receipts. Notably, a large share of total income excise is collected from businesses for which DOR lists receipts information as “Missing, Less or Equal to Zero.” Much of this income excise in fact may be – and very likely is – collected from large businesses, meaning that far more than half of excise collections likely comes from businesses with receipts above $500 million. Unfortunately, this limitation in the DOR data does not allow for a more detailed analysis. Less than 15 percent of total corporate income excise tax collections in 2019 is directly attributable to businesses with less than $100 million in annual receipts. See 2019 Corporate Excise Report, Table 2, Row 3: https://www.mass.gov/lists/dor-corporate-excise-return-reports
11 Bartik, Timothy, Making Sense of Incentives, 2019 (Preface, pg. xiv): https://research.upjohn.org/cgi/viewcontent.cgi?article=1277&context=up_press
Urban Institute, “Tax Incentives for Economic Development”, February 2016 (see Introduction): https://www.urban.org/research/publication/state-tax-incentives-economic-development
12 MassBudget, “The Growing Cost of Special Business Tax Breaks”, May 2017: https://www.massbudget.org/reports/pdf/SpecialBizTaxBreaks_Update%205-10-2017%20FINAL.pdf
13 MassBudget, “The Growing Cost of Special Business Tax Breaks”, May 2017: https://www.massbudget.org/reports/pdf/SpecialBizTaxBreaks_Update%205-10-2017%20FINAL.pdf
14 MassBudget, “The Single Sales Factor Tax Break: Has It Worked?”, January 2016: https://www.massbudget.org/reports/pdf/Single%20Sales%20Factor%20FINAL.pdf
Boston Globe, “Fidelity’s Mass. workforce shrinking”, June 8, 2010: http://archive.boston.com/business/articles/2010/06/08/fidelitys_mass_workforce_shrinking/
Boston Globe, “Mass. Lawmakers grill Fidelity, Evergreen execs”, March 29, 2011: http://archive.boston.com/news/local/massachusetts/articles/2011/03/29/mass_lawmakers_to_grill_fidelity_evergreen_execs/
15 Massachusetts Department of Revenue, Massachusetts Film Industry Tax Incentive Report (2015): https://www.mass.gov/lists/other-dor-reports#massachusetts-film-industry-tax-incentive-reports-
MassBudget, “The Massachusetts Film Tax Credit”, March 2015: http://www.massbudget.org/report_window.php?loc=The%20Massachusetts%20Film%20Tax%20Credit.html
16 See Center on Budget and Policy Priorities, “State Corporate Tax Disclosure”, 2007: https://www.cbpp.org/sites/default/files/atoms/files/2-13-07sfp.pdf
17 M.G.L. Chapter 62C, Section 83:
18 Jane G. Gravelle, Policy Options to Address Corporate Profit Shifting: Carrots or Sticks?, April 2016, pgs. 1-2 http://www.law.nyu.edu/sites/default/files/upload_documents/Jane%20Gravelle.pdf
Other examples of reports highlighting the growth of corporate tax avoidance include the following:
The Institute on Taxation and Economic Policy report, “Corporate Tax Avoidance Remains Rampant Under New Tax Law”, July 2021: https://itep.org/corporate-tax-avoidance-under-the-tax-cuts-and-jobs-act/ and
Center on Budget and Policy Priorities, “Growing Tax Avoidance by Multinationals Undermines Competition, OECD Warns” February 2013: https://www.cbpp.org/blog/growing-tax-avoidance-by-multinationals-undermines-competition-oecd-warns
19 Massachusetts already provides corporations with the option of filing using WWCR. Department of Revenue data show that approximately 100 corporations choose to do so each year. Presumably, these corporations make this election because, given their particular financial circumstances in a given year, WWCR rules result in a lower tax obligation to the Commonwealth.
20 ITEP’s estimate of potential Massachusetts revenue gain ($670 million per year) is based on a pre-Tax Cuts and Jobs Act (TCJA) estimate of how much profit was being shifted out of the U.S. More recent research indicates that TCJA – with its sharp reduction in the federal corporate income tax rate – has reduced such shifting modestly. This in turn suggests that a current estimate of the potential revenue gain for Massachusetts likely would be somewhat lower than $670 million a year.
21 There is broad agreement among economists that the final incidence of taxes on business income is divided among some combination of shareholders, landowners, workers and consumers with the relative weights carried by each group varying depending on industry and business location. See for example, Serrato & Zidar, “Who Benefits from State Corporate Tax Cuts?”, American Economic Review 2016, 106(9): 2582-2624.
Another useful review of the literature comes from Clemens Fuest et al., Annual Review of Economics, September 2023,“Who Bears the Burden of Corporate Income Taxation?”: https://www.annualreviews.org/doi/full/10.1146/annurev-economics-082322-014747 It is worth noting that, under any circumstance, corporate shareholders tend to be distributed nationally and internationally. For most large corporations with operations in Massachusetts, only a small percentage of shareholders would be Massachusetts residents. Thus, by and large, the incidence of any additional tax collected from corporations would not fall on Massachusetts residents.
22 In Massachusetts, 80 percent of capital gains (the passive income derived from capital assets, including, primarily, financial assets such as stocks and bonds) accrues to those in the highest 1 percent of households by income. Ninety percent of all capital gains flow to the highest 5 percent of Massachusetts households. (Analysis performed for MassBudget upon request by the Institute on Taxation and Economic Policy.)
23 See data visualization tool for U.S. Federal Reserve Board Survey of Consumer Finances: https://www.federalreserve.gov/econres/scf/dataviz/scf/chart/#series:Stock_Holdings;demographic:inccat;population:1,2,3,4,5,6;units:media
24 See data visualization tool for U.S. Federal Reserve Board Survey of Consumer Finances: https://www.federalreserve.gov/econres/scf/dataviz/scf/chart/#series:Stock_Holdings;demographic:racecl4;population:1,2,3,4;units:have;range:1989,2022
25 See data visualization tool for U.S. Federal Reserve Board Survey of Consumer Finances: https://www.federalreserve.gov/econres/scf/dataviz/scf/chart/#series:Stock_Holdings;demographic:racecl4;population:1,2,3,4;units:have;range:1989,2022
The Federal Reserve describes its “Other” category as “a diverse group that includes those identifying as Asian, American Indian, Alaska Native, Native Hawaiian, Pacific Islander, other race, and all respondents reporting more than one racial identification. See https://www.federalreserve.gov/econres/notes/feds-notes/recent-trends-in-wealth-holding-by-race-and-ethnicity-evidence-from-the-survey-of-consumer-finances-20170927.htm
26 Council on State Taxation, “Total State and Local Business Taxes, FY2021”, Table 5 (pg. 16): https://www.cost.org/globalassets/cost/state-tax-resources-pdf-pages/cost-studies-articles-reports/2209-4097478_50-state-tax-2022-final-e-file.pdf
Compared to most other states, Massachusetts collects a relatively large share of total business taxes through its corporate income tax. Other states tend to collect more of their business taxes through sales taxes, licensing fees and various non-income excise taxes. Some states also collect significant amounts of business taxes at the county or municipal level, rather than at the state level. To properly compare overall state business tax levels, it is necessary to take all these tax types and taxing jurisdictions into account.
27 Center on Budget and Policy Priorities, testimony of Chye-Ching Huang to House Budget Committee, February 27, 2019: https://www.cbpp.org/research/federal-tax/fundamentally-flawed-2017-tax-law-largely-leaves-low-and-moderate-income
28 Institute on Taxation and Economic Policy, “Extending Temporary Provisions of the 2017 Trump Tax Law”, May 2023, (Figure 9): https://itep.org/extending-temporary-provisions-of-the-2017-trump-tax-law-national-and-state-by-state-estimates/ ITEP’s estimate here is for Tax Year 2026.
29 Council on State Taxation, “Total State and Local Business Taxes FY 2021” (Table 1): https://www.cost.org/globalassets/cost/state-tax-resources-pdf-pages/cost-studies-articles-reports/2209-4097478_50-state-tax-2022-final-e-file.pdf
According to COST’s study, total state and local corporate income taxes in FY2020 were $72.4 billion and $111.0 billion in FY2021.
30 U.S. Bureau of Economic Analysis, state-by-state GDP visualization homepage. For 2022 (most recent data available), Massachusetts = $604.4 billion, U.S. = $21,822.0 billion
31 Corporate excise and related tax collections in Massachusetts totaled $5.1 billion in FY 2023.
Source: Massachusetts Department of Revenue


